Fig. 1.
Download original image
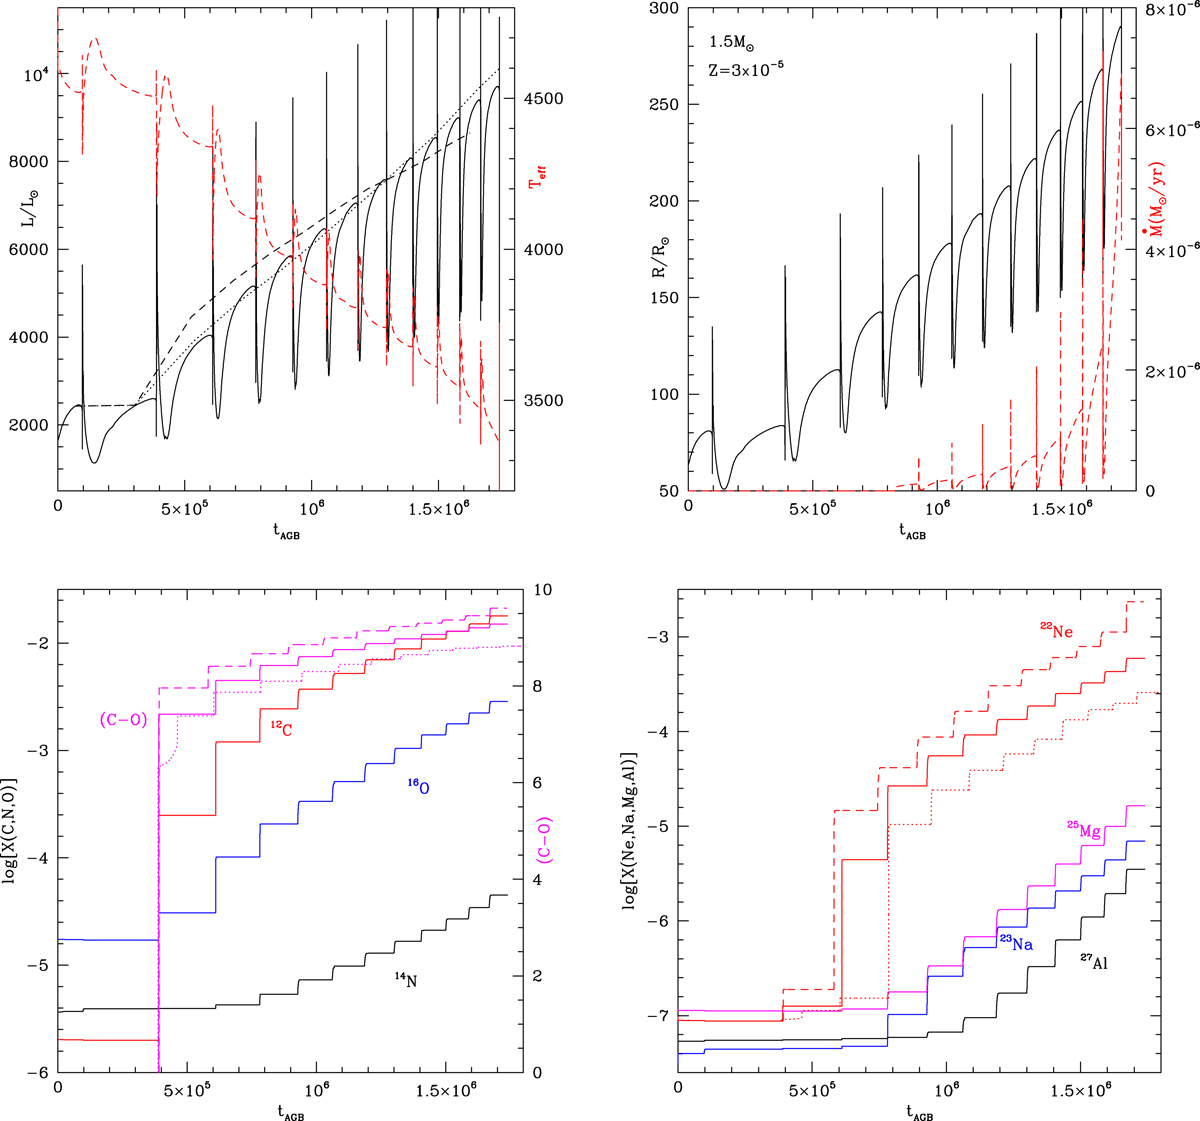
Evolution of the 1.5 M⊙ model star with metallicity Z = 3 × 10⁻⁵ as a function of the time, counted from the beginning of the TP-AGB phase. The top-left panel reports the variation in luminosity (solid black scale on the left) and of the effective temperature (dashed red scale on the right). The evolution of the stellar radius (scale on the left) and of the mass-loss rate (scale on the right) are shown in the top right panel, as solid black and dashed red lines, respectively. The variation in CNO surface abundances is shown in the bottom left panels, where the different lines refer to the mass fractions of 12C (red), 14N (black), 16O (blue), and (C–O) (dashed magenta scale on the right; see text for the definition). The bottom right panel reports the variation in surface mass fractions of 22Ne (red line), 23Na (blue), 25Mg (magenta), and 27Al (black). The dotted (dashed) black line in the top left panel connects the luminosity values taken in the middle of each inter-pulse of a model star of the same initial mass and metallicity, calculated by assuming that during the AGB phase, the OS is a factor 2 lower (higher) than in the standard case. The same holds for the dotted and dashed magenta lines in the bottom left panel, indicating the evolution of the surface (C−O), and the red lines in the bottom right panel, which refer to the surface 22Ne.
Current usage metrics show cumulative count of Article Views (full-text article views including HTML views, PDF and ePub downloads, according to the available data) and Abstracts Views on Vision4Press platform.
Data correspond to usage on the plateform after 2015. The current usage metrics is available 48-96 hours after online publication and is updated daily on week days.
Initial download of the metrics may take a while.