| Issue |
A&A
Volume 653, September 2021
|
|
|---|---|---|
| Article Number | A1 | |
| Number of page(s) | 6 | |
| Section | Astrophysical processes | |
| DOI | https://doi.org/10.1051/0004-6361/202141330 | |
| Published online | 31 August 2021 | |
Mg2SiO4 particle aggregation aboard the ISS
Influence of electric fields on aggregation behavior, particle velocity, and shape-preferred orientation⋆
Institute of Geoscience (IfG), Goethe University Frankfurt, Altenhoeferallee 1, 60320 Frankfurt, Germany
e-mail: This email address is being protected from spambots. You need JavaScript enabled to view it.
Received:
17
May
2021
Accepted:
9
July
2021
Abstract
Context. Particle aggregation in the solar nebula played a major role in the framework of planet formation; for example, primitive meteorites and their components formed by different aggregation processes. These processes are still not completely understood.
Aims. Electrostatic forces probably influenced particle aggregation in the early Solar System. We developed an experiment that was carried out under long-term microgravity conditions aboard the International Space Station (ISS) to expand the knowledge of charge-influenced particle aggregation.
Methods. Aggregation of freely floating, elongated, angular, and polycrystalline Mg2SiO4-particles was observed under long-term microgravity conditions while being exposed to electric fields as well as low- and high-energy electric discharges.
Results. Nearly all of the particles formed an aggregate, which freely floated in the sample chamber prior to the discharge experiments. The aggregate was attracted by the electrodes and partly disintegrated by low-energy electric discharges. High-energy arc discharges accelerated the particles, which reassembled in chains parallel to the field lines of the subsequent electric field between the electrodes. A strong shape-preferred orientation of the longest grain axis parallel to the field lines was observed in the Mg2SiO4-particles. With increasing strength of the electric field, the particle chains narrowed, leading to the formation of a compact aggregate.
Conclusions. In microgravity conditions, electrostatic forces influence the aggregation process in terms of aggregate growth rate, morphology, packing density, and particle orientation. These observations help us to better understand the formation and compaction mechanism of early Solar System aggregates.
Key words: methods: laboratory: solid state / solid state: refractory / protoplanetary disks / turbulence / astrochemistry / planets and satellites: formation
The 3 videos are available at https://www.aanda.org
© ESO 2021
1. Introduction
Aggregation of particles in the early stage of the Solar System is considered to be one of the first and most important processes leading to planet formation (Cuzzi & Weidenschilling 2006; Weidenschilling & Cuzzi 2006; Dominik et al. 2007; Blum & Wurm 2008). For example, primitive meteorites and their components, including amoeboid olivine aggregates (AOAs); calcium-aluminum-rich inclusions (CAIs); matrix material; and chondrules, which probably represent planet precursors, are the result of different early aggregation processes (Russel et al. 2018).
The aggregation behavior of particles in the early Solar System and the internal structure of particle aggregates depend on numerous parameters, and there are still many unsolved questions (Dominik & Tielens 1997; Poppe et al. 2000; Blum 2006; Blum & Wurm 2008; Dominik et al. 2007; Güttler et al. 2010). For instance, the evolution of the porosity and the compaction of aggregates influenced the structure of the protoplanetary disk, for example, the formation of a dense mid-plane layer (Ormel et al. 2007; Kataoka et al. 2013; Kataoka 2017) and different processes such as collisions and compaction by gas and by self-gravity have been proposed as mechanisms for compaction (Dominik & Tielens 1997; Dominik et al. 2007; Blum & Wurm 2008). However, the estimated porosity of aggregates formed by these processes is higher than porosities usually observed in extraterrestrial samples (Weidenschilling & Cuzzi 2006; Forman et al. 2016). Another enigma is the coagulation of chondrule-sized objects to larger, centimeter-to-meter-sized objects, since experimental work has shown that chondrule-sized objects bounce off each other rather than sticking together after collisions, due to the so-called bouncing barrier (Zsom et al. 2010; Güttler et al. 2010; Kruss et al. 2017; Steinpilz et al. 2020).
Electrostatic forces strongly affect the behavior of dust particles (e.g., Shinbrot 2014; Siu et al. 2015), and therefore they have been considered as a possible mechanism that influenced particle aggregation in the protoplanetary disk (e.g., Poppe et al. 2000; Marshall et al. 2005; Konopka et al. 2005; Okuzumi 2009; Love et al. 2014; Jungmann et al. 2018; Steinpilz et al. 2020). For example, it was experimentally demonstrated that charged 500 μm-sized glass spherules stick together after collisions even if they have higher velocities than uncharged spherules (Jungmann et al. 2018). Another experiment in microgravity conditions showed that 400 μm-sized quartz spherules formed centimeter-sized, stable aggregates, where the spherules formed parallel chains within the aggregates (Marshall et al. 2005). The coaxial alignment of these spherules was interpreted as the result of an alignment of the quartz dipole axis. These aggregates also attracted freely levitating particles. Furthermore, informal experiments aboard the International Space Station (ISS) have shown that electrostatic forces can lead to the formation of dense, spheroidal aggregates of sucrose (Love et al. 2014). Most recently, experiments with charged, approx. 430 μm-sized SiO2 glass spherules, showed that charged particles form aggregates with sizes beyond the bouncing barrier with collision velocities of > 10 cm s−1 (Steinpilz et al. 2020).
We carried out an experiment aboard the ISS, which was primarily developed to examine chondrule formation by arc discharges (Spahr et al. 2020). In this experiment, freely floating Mg2SiO4 (forsterite) particles were exposed to electrical discharges in order to simulate chondrule formation under reasonably realistic conditions. In the framework of this experiment, we could also study particle aggregation in electric fields and their response to electric discharges, which expands our knowledge of charge-influenced particle aggregation. These observations can potentially offer new constraints on aggregation processes, adhesive forces, and the texture and microstructure of chondrule precursors.
2. Methods
2.1. Experimental set-up and sample material
The experiment was performed aboard the International Space Station (ISS) inside a 10 × 10 × 15 cm3-sized NanoRacks NanoLab (Spahr et al. 2020). Two types of electrical discharges were induced: ignition sparks and arc discharges. Ignition sparks represent short (approx. 4 μs), low-energy (Q ≪ 0.01 J) discharges, while arc discharges have a longer discharge duration (approx. 300–400 μs) with higher energies (Q = 5–8 J). Figure 1a shows a schematic circuit diagram of the discharge generation electronics. First, a DC–DC converter charged three parallel capacitors ( ) to apply the electric field between the electrodes. The short ignition sparks were then induced by the ignition coil. An electric field between the electrodes remained up to 60 s after the ignition sparks. In order to generate longer, high-energy arc discharges, the energy stored in Carc was released into the ionized channel generated by the ignition coil. The capacitors were subsequently charged in preparation for the next arc discharge.
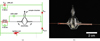 |
Fig. 1. Experimental set-up. (a) Schematic illustration of the most relevant parts of the arc generation circuit connected to the sample chamber. A DC–DC converter charged three parallel capacitors ( |

Figure 1b shows a photograph of the sample chamber. It was manufactured from quartz glass and two tungsten electrodes with a diameter of 1 mm and a spark gap of approx. 2 mm were fused into the glass. The sample chamber was loaded with 100 ± 1 mbar Argon gas and the sample material. The sample material consisted of 30 ± 1 mg Mg2SiO4 particles, which corresponds to approx. 104 particles. The particles vary in size from 80–180 μm (mean diameter 126 ± 32 μm) and were polycrystalline, highly porous, angular, and often slightly elongated (Spahr et al. 2020). The behavior of the Mg2SiO4 particles in the sample chamber was observed with a Raspberry Pi V2 camera with a field of view (FOV) of 2.73 × 3.63 mm. The resolution was 1232 × 1640 pixel with a frame rate of 40 fps. The focal depth is approx. 1 mm. For more details on the experimental set-up and the sample material we refer the reader to Spahr et al. (2020) or the GitHub repository1.
2.2. Experimental stages
The experiment is divided into three different operational stages:
-
Initial situation and particles in the electric field. First, videos and photographs were collected prior to any operational command. Subsequently, the capacitor Carc was charged to U = 110–160 V to apply an electric field between the electrodes.
-
Ignition spark experiments. Carc was charged to voltages in the range of U = 110–160 V over a duration of 60 s, which applied an electric field between the electrodes. The capacitor voltage was kept constant for another 60 s, and the ignition spark was subsequently induced by the ignition coil. An electric field that was strong enough to affect particles remained over a duration of approx. 60 s after the discharge. The complete charging process and the ignition spark were filmed.
-
Arc discharge experiments. Carc was charged to an adjustable target voltage of U = 150–190 V for approx. 60 s. The capacitor voltage was kept constant for another 60 s until the arc discharge was released between the electrodes. Carc was subsequently charged in preparation for the next arc discharge. The complete charging process and the arc discharges were filmed.
2.3. Velocity analysis
Video analysis was performed using the Tracker – Video Analysis and Modelling Tool software (Brown 2008). The particle positions (x, y) were determined for each particle on each frame of the video to determine the particle trajectories and velocities, beginning from the discharge event (t = 0 s). The program calculated the velocities from the position-time data with the average velocity over a two-step interval. The relatively low frame rate of the camera and the rather poor contrast limited the precision of the particle position analysis and the particle positions could not always be determined for each frame. The particle velocities in the approximately first ten frames were determined from the length of particle traces during an exposure. The error in the velocity determination can be estimated to be in the range of 0.1–2 mm s−1, which is due to the limited frame rate, the contrast conditions of the images and because the third dimension was neglected.
3. Results
3.1. Stage I: Initial situation and particles in the electric field
The first set of videos received from the ISS showed that within the limited field of view in the center of the experimental chamber, a few particles stuck to the electrodes and the sample chamber wall (Fig. 2a). Ten days after the rocket launch, the capacitors were charged for the first time, which led to the appearance of a particle aggregate in the corner of the field of view. With increased charge, the aggregate moved toward the center of the field of view before settling between the electrodes (Fig. 2b). The aggregate had an approximate size of 2 × 2 × 4 mm3, which presumably contained nearly all approx. 104 particles inside the sample chamber. It is densely packed and has an approximately ellipsoidal morphology (Fig. 2b).
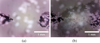 |
Fig. 2. Field of view of the camera aboard the ISS. (a) The first image captured aboard the ISS. The electrodes are on the left- and right-hand sides of the image. Some particles stuck to the electrodes and the sample chamber wall. (b) A spheroidal, dense aggregate levitating between the electrodes. |
At this stage of the experiment, the aggregates appeared frequently whenever the capacitors were charged. The long axis of the ellipsoidal aggregate aligned itself between the two electrodes. As soon as the electric field was turned off, the aggregate moved out of the field of view with a velocity of approx. 0.7 ± 0.1 mm s−1. This aggregate represents the initial situation before the discharge experiments started.
3.2. Stage II: Ignition spark experiments
Some ignition sparks were induced while the aggregate was levitating between the electrodes; in other cases, the space between the electrodes was empty. Figure 3a shows the aggregate immediately before the ignition spark was induced, and Fig. 3b shows the situation inside the sample chamber 0.3 s after the ignition spark. The particles in the impacted volume flew in various directions, while the main part of the aggregate stayed intact (see online video V1). The aggregate itself stayed attached to the electrodes but revolved around the electrode, as indicated by the arrows in Fig. 3b. Some ignition sparks separated the aggregate in two main parts, where one part moved instantly out of the field of view with a velocity of 3.1 ± 0.5 mm s−1, while the other part stayed attached to one of the electrodes. Immediately after the discharge, many of the dispersed particles reunited with the aggregate. After several ignition sparks and with increased charging of Carc in preparation for stage III, the aggregate disappeared.
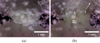 |
Fig. 3. Aggregate before and immediately after the impact of an ignition spark. (a) Aggregate levitating between the electrodes while the capacitors were charged. (b) Situation inside the sample chamber 0.3 s after the ignition spark. The arrows show the direction in which the aggregate parts moved. The right part of the aggregate was destroyed (1), whereas the main part of the aggregates moved to the left side (2). |
The trajectories and the resulting velocities of the particles after ignition sparks were analyzed in detail for a few representative cases. Figure 4a shows the particle trajectories after an ignition spark. The direction of the particle motion was influenced by an attraction to the electrodes. Figure 4b shows the velocities of particles after different ignition spark events. A few particles reached velocities of > 25 mm s−1. Most particles moved with velocities between 0.1 and 10 mm s−1. Their velocities increased after approx. 1 s after the discharge when they were attracted by the electrodes.
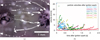 |
Fig. 4. Velocity analysis of particles after ignition sparks. (a) Particle trajectories over 1.7 s after a representative ignition spark, which was induced without the aggregate between the electrodes. White circles mark the position of the particles in the single frames. The directions of movement of the particles were influenced by the electrostatic attraction of the electrodes. (b) Velocities of particles after an ignition spark (t = 0 s). The numbers in the top right-hand corner represent different discharge events. The first two ignition sparks (221921_659, 220433_775) were induced while the aggregate was levitating between the electrodes. The other ignition sparks were induced when the space between the electrodes was empty, but the electrode tips were covered with particles. The velocity increase is caused by the attraction of the electrodes. |
3.3. Stage III: Arc discharge experiments
The generation of high-energy arc discharges caused a higher degree of random particle motion in the sample chamber. Although the first two arc discharges were induced when the space between the electrodes was almost empty, the arc discharges led to a random particle motion inside the sample chamber (Fig. 5a). The electric field prior to the third arc discharge was applied while the particles were still in motion. The moving particles were deflected from their path by the attraction of the electrodes and formed chains parallel to the field lines of the electric field between the electrodes (Fig. 5b and online video V2). The particles moved with velocities of approx. 1 mm s−1 toward the electrodes and reached up to approx. 4 mm s−1 before they stopped at their final position in the chain. A few particles, which were levitating closer to the left electrode, were attracted by the right electrode and vice versa. Figure 5c shows a close-up of the particle chains that reveals that the particles aligned with their longest axis parallel to the electrodes, which is also parallel to the field lines of the electric field. With increasing charging voltage, the vertical distance between the particle chains decreased, which led to the formation of a more closely packed aggregate (Fig. 5d). A subsequent arc discharge scattered these particles completely (see online video V3). The electric field, which was applied when the capacitors were charged for the fourth arc discharge (U = 170 V), again caused the formation of particle chains parallel to the field lines between the electrodes. However, the number of particle chains, which accumulated between the electrodes, decreased with further arc discharges.
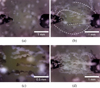 |
Fig. 5. Particle aggregation in the electric field. (a) Particles were in motion inside the sample chamber; screenshot from approx. 0.7 s after the second arc discharge. (b) Electric field that was applied prior the third arc discharge (U = 170 V) caught the particles that aligned along chains parallel to the field lines; photograph approx. 110 s after the second arc discharge. The dashed white lines better visualize some chains of particles. The longest particle axis aligned itself parallel to the field lines. (c) Close-up of (b) with enhanced contrast. The particles aligned with their longest axes parallel to the field lines. (d) With increasing charging voltage, the vertical distance between the particle chains decreased, which led to the formation of a more closely packed aggregate; screenshot taken approx. 130 s after the second arc discharge. |
Figure 6a shows the trajectories of particles after the last high-energy arc discharges (Q ≈ 8 J). In contrast to particles after ignition sparks, the particle trajectories do not show any specific direction. Many particles reached velocities of > 60 mm s−1, which were calculated from the length of the particle traces on a single frame. Higher velocities are probable. Figure 6b shows the velocities versus time after arc discharge that we were able to calculate from the particle positions. The particles reached velocities > 25 mm s−1. The particle velocity decreased exponentially within the first 0.5 s after the discharge event.
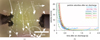 |
Fig. 6. Velocity analysis of particles after arc discharges. (a) Particle trajectories of different particles during the first 1.3 s after an arc discharge. White circles mark the position of the particles in single frames; however, the particle position could not be observed for every frame due to low contrast conditions. The distances between the circles are not always equivalent for the velocity. (b) Particle velocities after high-energy arc discharges. The velocity decreased exponentially after the arc discharge. The arc discharges 220504_1010, 002003_1011, 023500_2012, and 045013_1013 represent arc discharges with Q ≈ 8 J, which were induced while the space between the electrodes was empty. The arc discharges 015742_775 and 021755_775 represent arc discharges that hit the aggregate with Q ≈ 6.5 J. The acceleration after 1.5 s is due to the attraction of the electrode. |
A least-squares fit of the solution to the equation of motion with Stokes’ gas drag (Stokes 1851) and constant external force to the experimental data was performed, which can be expressed as follows:
 (1)
(1)
where v is the velocity of the particle at time t, a is essentially the starting velocity at t = 0 s (discharge event), b represents the gas-grain coupling time, and c is the velocity of the particle after the deceleration. The fitting results are summarized in Table 1. The widespread distribution of the maximum velocity of the particles after an arc discharge a could be the result of different particle trajectories before the particle position could be tracked. The mean gas-grain coupling time for all analyzed particles was determined to be b = 0.14 ± 0.1 s, which matches the calculated gas-grain coupling time with Stokes’ law (Stokes 1851) using the viscosity of Ar at 100 mbar, which is μ ≈ 2 × 10⁻⁵ kg m s−1 (Kestin & Leidenfrost 1959) for particles with a mean radius of r = 63.5 μm and a mass of 3.28 × 10⁻⁹ kg. The parameter c describes the particle response to the electric field and the attraction of the electrodes without the influence of gas motion.
Fitting results of the solution to the equation of motion with Stokes’ gas drag and constant external force to the experimental data.
4. Discussion
The starting condition of the experiment (stage I) was a densely packed aggregate, which was probably held together due to attractive forces such as Van-der-Waals or electrostatic forces due to tribocharging prior to the experiment during transportation. In microgravity conditions, the aggregate was attracted by the electrodes until it placed and aligned itself between the electrodes. The electric field may have polarized the complete aggregate. The aggregate morphology is similar to the initial situation of other particle aggregation experiments at microgravity (e.g., Steinpilz et al. 2019), to the centimeter-sized aggregates observed by Marshall et al. (2005) of 400 mm-sized spherical quartz particles and to aggregates of sucrose formed by experiments aboard the ISS by Love et al. (2014). The maximal size of the aggregates in the experiment was limited by the number of dust particles in the sample chamber.
During experimental stage II, we observed that short ignition sparks disintegrated the part of the aggregates that was transversed by the spark, and the sputtered particles were attracted by the surviving aggregate. The observation that dust aggregates can attract particles due to electrostatic attraction was also made by Marshall et al. (2005). Consequently, aggregates of charged particles in protoplanetary disk have a higher stability regarding any disturbances, which is in accordance with previous observations (Marshall et al. 2005; Love et al. 2014). Furthermore, the trajectories of the particle motions triggered by the ignition sparks were mainly influenced by the attraction of the electrodes.
In experimental stage III, high-energy arc discharges accelerated the particles, which subsequently aggregated in particle chains parallel in the electric field lines. With increasing charging voltages, these chains formed an aggregate with coaxial shape-alignment of most particles. It is not clear if the particles were polarized prior to the experiments; however, it is most likely that the particle behavior is caused by dielectrophoresis (e.g., Pohl 1978; LaMarche et al. 2010; Shinbrot 2014). The electric field has probably induced dipoles parallel the longest grain axis, which caused the alignment of the dipole axis parallel to the field lines and the formation of particle chains.
The formation of particle chains in aggregates by alignment of the quartz dipole axis of quartz spherules was observed in the experiment of Marshall et al. (2005). In the scope of our experiment, we show that an alignment can also occur when multi-grain particles have an elongated morphology. Furthermore, the electronic polarizability of forsterite is more than twice the polarizability of quartz (Lasaga & Cygan 1982), and experiments have shown that olivine-bearing basalt spheres charge more strongly than glass spherules (Steinpilz et al. 2020). Therefore, forsterite represents a highly recommendable and realistic material for future aggregation experiments.
The porosity reduction of protoplanetary dust aggregates plays an important role in planetesimal formation and different scenarios, such as collisions of similar-sized dust aggregates, static compression by disk gas or by self-gravity have been proposed to increase the volume filling factor (Dominik & Tielens 1997; Ormel et al. 2007; Suyama et al. 2008; Kataoka et al. 2013). In addition to these mechanisms, we have shown that electric fields can help to reduce the porosity of particle aggregates, which was further enhanced by the elongated morphology of the grains. A pre-alignment of particles also changes the magnitude and intensity required for compression events on aggregates and young planetary bodies.
The pressure and particle density in the sample chamber (approx. 1.6 × 10⁻³ g cm−3) differ from the parameters, which are assumed for the overall planet forming region of the Solar Nebula by a factor of 105–108 (Zsom et al. 2010; Weidenschilling 1977; Hayashi 1981). However, locally higher densities in the Nebula could be reached by turbulences (Love et al. 2014; Cuzzi et al. 2001). Centimeter-sized aggregates grown by hit-and-stick collision could have formed over a period of approx. 1000 to several thousands of years (Blum & Wurm 2008 and references therein). The results of the experiment suggest that even at lower particle densities, electrostatic forces could substantially decrease aggregation times, since particles can be attracted over greater distances than previously assumed.
5. Conclusion
We studied the behavior of dust particles under long-term microgravity conditions aboard the ISS under the influence of electric fields and their response to electrical discharges. We show that electrostatic forces, the presence of an electric field, and electric discharges influence the aggregation process and aggregate morphology, the packing density in the aggregate, and the particle trajectories. Electric fields can also lead to strong shape-preferred orientation effects and porosity reduction in particle aggregates, which is an important process in the evolution of planet precursors.
Movies
Movie 1 associated with Fig. 6 (V1) Access Supplementary Material
Movie 2 associated with Fig. 6 (V2) Access Supplementary Material
Movie 3 associated with Fig. 6 (V3) Access Supplementary Material
Acknowledgments
This project was realized with the help of A.A. Beck, O. Christ, P.-T. Genzel and D. Mederos Leber. We thank the Hackerspace Ffm e. V., especially S. Fujita and J. Kerscher, R. Haseitl and S. Matthies for the help with the technical implementation and the software development. We thank J. Weppler and the German Aerospace Center DLR for taking care of the organization of this project. We thank NanoRacks LLC and DreamUp for the payload opportunity. We also thank the astronauts aboard the ISS under the commandant of A. Gerst for the implementation of the experiment. Funding: We are grateful for financial support provided by the Dr. Rolf M. Schwiete Stiftung, the German Aerospace center DLR, NanoRacks LLC, DreamUp, Biovia, the BmWi (50JR1704) and DFG (BR2015/35-1; Wi1232/44-1), Nordlicht GmbH and ZEISS. This manuscript benefitted from the comments and suggestions of an anonymous reviewer.
References
- Blum, J. 2006, Adv. Phys., 55, 881 [NASA ADS] [CrossRef] [Google Scholar]
- Blum, J., & Wurm, G. 2008, A&A, 46, 21 [CrossRef] [Google Scholar]
- Brown, D. 2008, Tracker Video Analysis and Modeling Tool, https://physlets.org/tracker/ [Google Scholar]
- Cuzzi, J. N., & Weidenschilling, S. J. 2006, in Meteorites and the Early Solar System II, eds. D. S. Lauretta, & H. Y. McSween, 353 [Google Scholar]
- Cuzzi, J. N., Hogan, R. C., Paque, J. M., & Dobrovolskis, A. R. 2001, ApJ, 546, 496 [NASA ADS] [CrossRef] [Google Scholar]
- Dominik, C., & Tielens, A. G. G. M. 1997, ApJ, 480, 647 [NASA ADS] [CrossRef] [Google Scholar]
- Dominik, C., Blum, J., Cuzzi, J. N., & Wurm, G. 2007, in Protostars and Planets V, eds. B. Reipurth, D. Jewitt, & K. Keil, 257 [Google Scholar]
- Forman, L. V., Bland, P. A., Timms, N. E., et al. 2016, EPSL, 452, 133 [NASA ADS] [CrossRef] [Google Scholar]
- Güttler, C., Blum, J., Zsom, A., Ormel, C. W., & Dullemond, C. P. 2010, A&A, 513, A56 [NASA ADS] [CrossRef] [EDP Sciences] [Google Scholar]
- Hayashi, C. 1981, Prog. Theor. Phys., Suppl., 70, 35 [Google Scholar]
- Jungmann, F., Steinpilz, T., Teiser, J., & Wurm, G. 2018, J. Phys. Commun., 2, 095009 [Google Scholar]
- Kataoka, A. 2017, Formation, Evolution, and Dynamics of Young Solar Systems, eds. M. Pessah, & O. Gressel (Springer International Publishing), 143 [Google Scholar]
- Kataoka, A., Tanaka, H., Okuzumi, S., & Wada, K. 2013, A&A, 554, A4 [NASA ADS] [CrossRef] [EDP Sciences] [Google Scholar]
- Kestin, J., & Leidenfrost, W. 1959, Physica, 25, 1033 [NASA ADS] [CrossRef] [Google Scholar]
- Konopka, U., Mokler, F., Ivlev, A. V., et al. 2005, New J. Phys., 7, 227 [NASA ADS] [CrossRef] [Google Scholar]
- Kruss, M., Teiser, J., & Wurm, G. 2017, A&A, 600, A103 [NASA ADS] [CrossRef] [EDP Sciences] [Google Scholar]
- LaMarche, K. R., Muzzio, F. J., Shinbrot, T., & Glasser, B. J. 2010, Powder Technol., 199, 180 [Google Scholar]
- Lasaga, A. C., & Cygan, R. T. 1982, Am. Min., 67, 328 [Google Scholar]
- Love, S. G., Pettit, D. R., & Messenger, S. R. 2014, Meteorit. Planet. Sci., 49, 732 [NASA ADS] [CrossRef] [Google Scholar]
- Marshall, J. R., Sauke, T. B., & Cuzzi, J. N. 2005, Geophys. Res. Lett., 32, L11202 [NASA ADS] [CrossRef] [Google Scholar]
- Okuzumi, S. 2009, ApJ, 698, 1122 [NASA ADS] [CrossRef] [Google Scholar]
- Ormel, C. W., Spaans, M., & Tielens, A. G. G. M. 2007, A&A, 461, 215 [NASA ADS] [CrossRef] [EDP Sciences] [Google Scholar]
- Pohl, H. A. 1978, Dielectrophoresis: The Behavior of Neutral Matter in Nonuniform Electric Fields (Cambridge University Press) [Google Scholar]
- Poppe, T., Blum, J., & Henning, T. 2000, AJ, 533, 454 [NASA ADS] [CrossRef] [Google Scholar]
- Russel, S., Connolly, Jr., H. C., & Krot, A. N. 2018, Chondrules: Records of Protoplanetary Disk Processes (Cambridge University Press) [Google Scholar]
- Shinbrot, T. 2014, EPJ ST, 223, 2241 [NASA ADS] [Google Scholar]
- Siu, T., Pittman, W., Cotton, J., & Shinbrot, T. 2015, Granul. Matter, 17, 165 [Google Scholar]
- Spahr, D., Koch, T. E., Merges, D., et al. 2020, Icarus, 350, 113898 [CrossRef] [Google Scholar]
- Steinpilz, T., Musiolik, G., Kruss, M., et al. 2019, Rev. Sci. Ins., 90, 104503 [NASA ADS] [CrossRef] [Google Scholar]
- Steinpilz, T., Joeris, K., Jungmann, F., et al. 2020, Nat. Phys., 16, 225 [Google Scholar]
- Stokes, G. G. 1851, Cambridge Philos. Trans., 9, 8 [Google Scholar]
- Suyama, T., Wada, K., & Tanaka, H. 2008, ApJ, 684, 1310 [NASA ADS] [CrossRef] [Google Scholar]
- Weidenschilling, S. J. 1977, MNRAS, 180, 57 [Google Scholar]
- Weidenschilling, S. J., & Cuzzi, J. N. 2006, Meteorites and the Early Solar System, II, 473 [NASA ADS] [CrossRef] [Google Scholar]
- Zsom, A., Ormel, C. W., Güttler, C., Blum, J., & Dullemond, C. P. 2010, A&A, 513, A57 [NASA ADS] [CrossRef] [EDP Sciences] [Google Scholar]
All Tables
Fitting results of the solution to the equation of motion with Stokes’ gas drag and constant external force to the experimental data.
All Figures
|
Fig. 1. Experimental set-up. (a) Schematic illustration of the most relevant parts of the arc generation circuit connected to the sample chamber. A DC–DC converter charged three parallel capacitors ( |
| In the text | |
|
Fig. 2. Field of view of the camera aboard the ISS. (a) The first image captured aboard the ISS. The electrodes are on the left- and right-hand sides of the image. Some particles stuck to the electrodes and the sample chamber wall. (b) A spheroidal, dense aggregate levitating between the electrodes. |
| In the text | |
|
Fig. 3. Aggregate before and immediately after the impact of an ignition spark. (a) Aggregate levitating between the electrodes while the capacitors were charged. (b) Situation inside the sample chamber 0.3 s after the ignition spark. The arrows show the direction in which the aggregate parts moved. The right part of the aggregate was destroyed (1), whereas the main part of the aggregates moved to the left side (2). |
| In the text | |
|
Fig. 4. Velocity analysis of particles after ignition sparks. (a) Particle trajectories over 1.7 s after a representative ignition spark, which was induced without the aggregate between the electrodes. White circles mark the position of the particles in the single frames. The directions of movement of the particles were influenced by the electrostatic attraction of the electrodes. (b) Velocities of particles after an ignition spark (t = 0 s). The numbers in the top right-hand corner represent different discharge events. The first two ignition sparks (221921_659, 220433_775) were induced while the aggregate was levitating between the electrodes. The other ignition sparks were induced when the space between the electrodes was empty, but the electrode tips were covered with particles. The velocity increase is caused by the attraction of the electrodes. |
| In the text | |
|
Fig. 5. Particle aggregation in the electric field. (a) Particles were in motion inside the sample chamber; screenshot from approx. 0.7 s after the second arc discharge. (b) Electric field that was applied prior the third arc discharge (U = 170 V) caught the particles that aligned along chains parallel to the field lines; photograph approx. 110 s after the second arc discharge. The dashed white lines better visualize some chains of particles. The longest particle axis aligned itself parallel to the field lines. (c) Close-up of (b) with enhanced contrast. The particles aligned with their longest axes parallel to the field lines. (d) With increasing charging voltage, the vertical distance between the particle chains decreased, which led to the formation of a more closely packed aggregate; screenshot taken approx. 130 s after the second arc discharge. |
| In the text | |
|
Fig. 6. Velocity analysis of particles after arc discharges. (a) Particle trajectories of different particles during the first 1.3 s after an arc discharge. White circles mark the position of the particles in single frames; however, the particle position could not be observed for every frame due to low contrast conditions. The distances between the circles are not always equivalent for the velocity. (b) Particle velocities after high-energy arc discharges. The velocity decreased exponentially after the arc discharge. The arc discharges 220504_1010, 002003_1011, 023500_2012, and 045013_1013 represent arc discharges with Q ≈ 8 J, which were induced while the space between the electrodes was empty. The arc discharges 015742_775 and 021755_775 represent arc discharges that hit the aggregate with Q ≈ 6.5 J. The acceleration after 1.5 s is due to the attraction of the electrode. |
| In the text | |
Current usage metrics show cumulative count of Article Views (full-text article views including HTML views, PDF and ePub downloads, according to the available data) and Abstracts Views on Vision4Press platform.
Data correspond to usage on the plateform after 2015. The current usage metrics is available 48-96 hours after online publication and is updated daily on week days.
Initial download of the metrics may take a while.