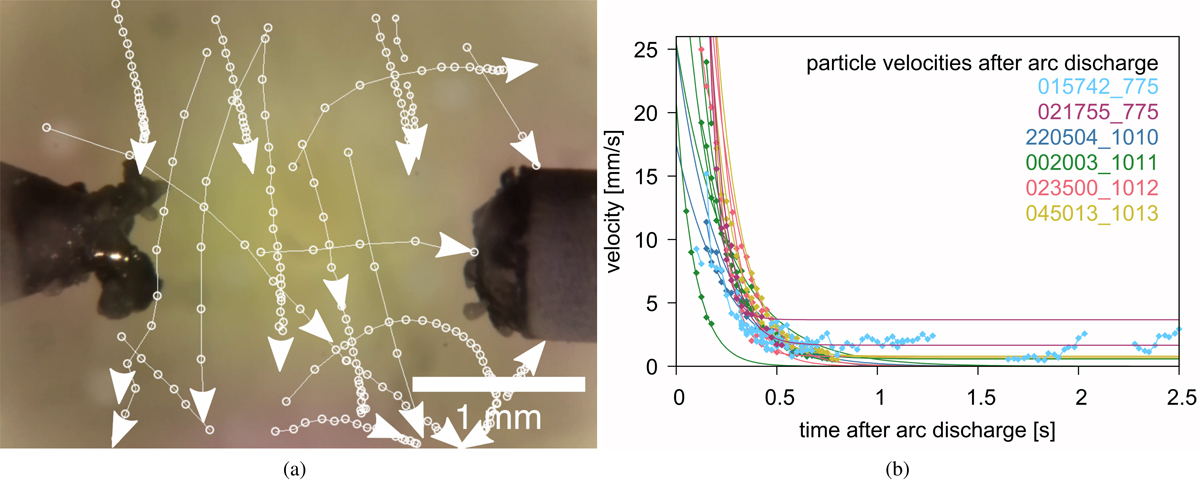
Fig. 6.
Download original image
Velocity analysis of particles after arc discharges. (a) Particle trajectories of different particles during the first 1.3 s after an arc discharge. White circles mark the position of the particles in single frames; however, the particle position could not be observed for every frame due to low contrast conditions. The distances between the circles are not always equivalent for the velocity. (b) Particle velocities after high-energy arc discharges. The velocity decreased exponentially after the arc discharge. The arc discharges 220504_1010, 002003_1011, 023500_2012, and 045013_1013 represent arc discharges with Q ≈ 8 J, which were induced while the space between the electrodes was empty. The arc discharges 015742_775 and 021755_775 represent arc discharges that hit the aggregate with Q ≈ 6.5 J. The acceleration after 1.5 s is due to the attraction of the electrode.
Current usage metrics show cumulative count of Article Views (full-text article views including HTML views, PDF and ePub downloads, according to the available data) and Abstracts Views on Vision4Press platform.
Data correspond to usage on the plateform after 2015. The current usage metrics is available 48-96 hours after online publication and is updated daily on week days.
Initial download of the metrics may take a while.