Fig. 4.
Download original image
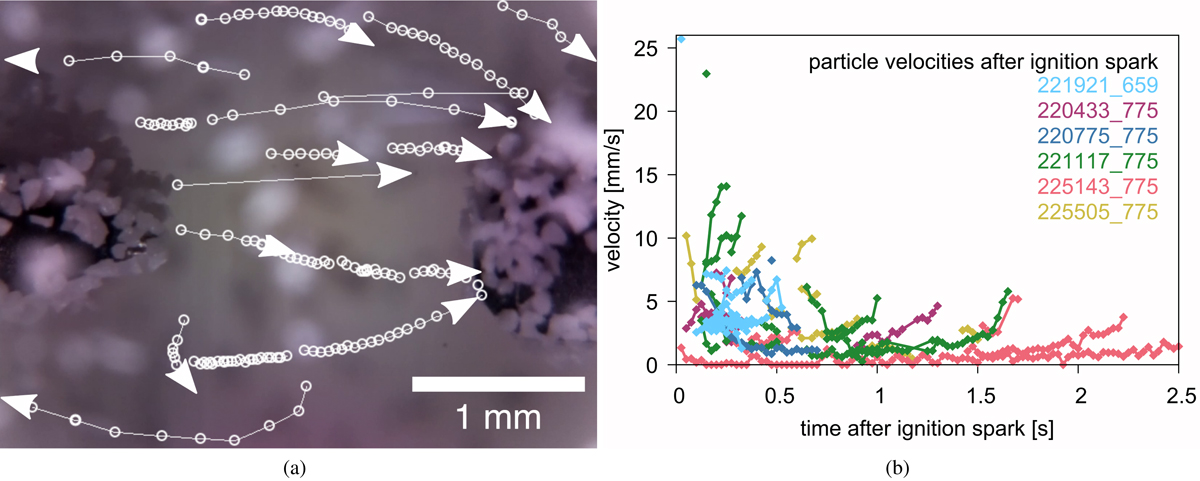
Velocity analysis of particles after ignition sparks. (a) Particle trajectories over 1.7 s after a representative ignition spark, which was induced without the aggregate between the electrodes. White circles mark the position of the particles in the single frames. The directions of movement of the particles were influenced by the electrostatic attraction of the electrodes. (b) Velocities of particles after an ignition spark (t = 0 s). The numbers in the top right-hand corner represent different discharge events. The first two ignition sparks (221921_659, 220433_775) were induced while the aggregate was levitating between the electrodes. The other ignition sparks were induced when the space between the electrodes was empty, but the electrode tips were covered with particles. The velocity increase is caused by the attraction of the electrodes.
Current usage metrics show cumulative count of Article Views (full-text article views including HTML views, PDF and ePub downloads, according to the available data) and Abstracts Views on Vision4Press platform.
Data correspond to usage on the plateform after 2015. The current usage metrics is available 48-96 hours after online publication and is updated daily on week days.
Initial download of the metrics may take a while.