Fig. 5.
Download original image
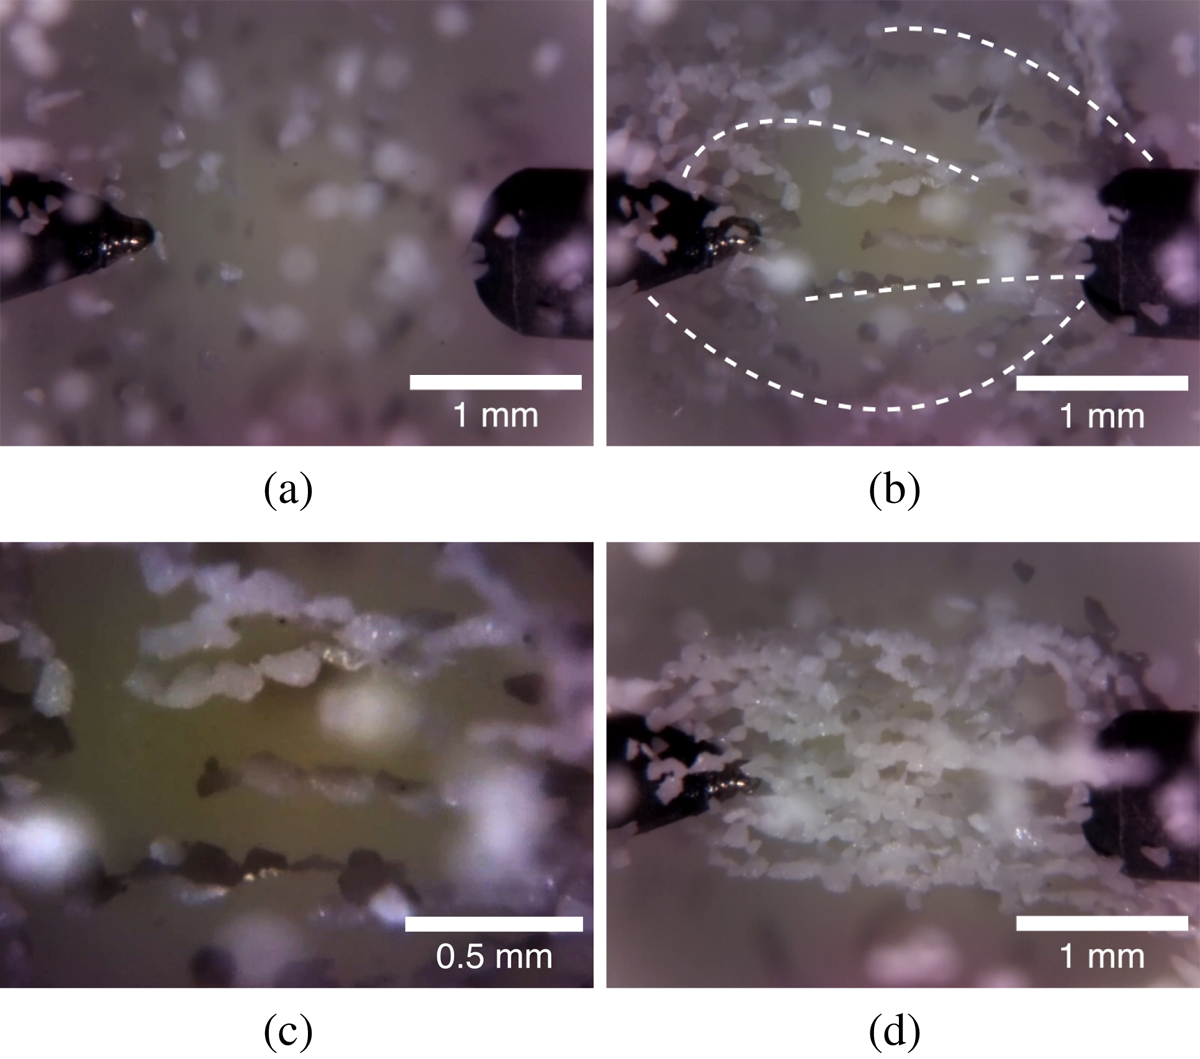
Particle aggregation in the electric field. (a) Particles were in motion inside the sample chamber; screenshot from approx. 0.7 s after the second arc discharge. (b) Electric field that was applied prior the third arc discharge (U = 170 V) caught the particles that aligned along chains parallel to the field lines; photograph approx. 110 s after the second arc discharge. The dashed white lines better visualize some chains of particles. The longest particle axis aligned itself parallel to the field lines. (c) Close-up of (b) with enhanced contrast. The particles aligned with their longest axes parallel to the field lines. (d) With increasing charging voltage, the vertical distance between the particle chains decreased, which led to the formation of a more closely packed aggregate; screenshot taken approx. 130 s after the second arc discharge.
Current usage metrics show cumulative count of Article Views (full-text article views including HTML views, PDF and ePub downloads, according to the available data) and Abstracts Views on Vision4Press platform.
Data correspond to usage on the plateform after 2015. The current usage metrics is available 48-96 hours after online publication and is updated daily on week days.
Initial download of the metrics may take a while.