| Issue |
A&A
Volume 652, August 2021
|
|
|---|---|---|
| Article Number | A48 | |
| Number of page(s) | 11 | |
| Section | Extragalactic astronomy | |
| DOI | https://doi.org/10.1051/0004-6361/202141242 | |
| Published online | 10 August 2021 | |
Tracing satellite planes in the Sculptor group
I. Discovery of three faint dwarf galaxies around NGC 253
1
Instituto de Astrofísica de Andalucía, CSIC, 18080 Granada, Spain
e-mail: This email address is being protected from spambots. You need JavaScript enabled to view it.
2
Special Astrophysical Observatory of the Russian Academy of Sciences, Nizhnij Arkhyz 369167, Russia
3
LESIA, Observatoire de Paris, Université PSL, CNRS, Sorbonne Université, Université de Paris, 5 Place Jules Janssen, 92195 Meudon, France
4
Leibniz-Institut für Astrophysik Potsdam (AIP), An der Sternwarte 16, 14482 Potsdam, Germany
5
UAI – Unione Astrofili Italiani /P.I. Sezione Nazionale di Ricerca Profondo Cielo, 72024 Oria, Italy
6
Perimeter Institute for Theoretical Physics, 31 Caroline St N, Waterloo, Canada
7
Instituto de Astrofísica de Canarias, c/ Vía Láctea s/n, 38205 La Laguna, Tenerife, Spain
8
Departamento de Astrofísica, Universidad de La Laguna, 38206 La Laguna, Tenerife, Spain
9
Cerro Tololo Inter-American Observatory, NSF’s NOIRLab, Casilla 603, La Serena, Chile
10
Instituto de Alta Investigación, Sede Esmeralda, Universidad de Tarapacá, Av. Luis Emilio Recabarren 2477, Iquique, Chile
Received:
3
May
2021
Accepted:
15
June
2021
Abstract
Context. In recent years, a new generation of large-scale imaging surveys have probed wide field regions for the first time around some nearby galaxies in an unprecedentedly low surface-brightness regime (∼28.0−29.0 mag arcsec−2). This provides the chance to discover very faint dwarf satellites by means of systematic visual inspection of these public deep images.
Aims. In this paper, we report the first results of a systematic survey of faint dwarf spheroidal galaxies in the vicinity of the bright late-type spiral galaxy NGC 253 by means of a visual inspection of the images taken by the Dark Energy Survey.
Methods. We performed a new NGC 253 satellite search using co-added image cutouts reprocessed in the DESI Legacy image surveys. We used GALFIT software to investigate the photometric and structural properties of three dwarf galaxies.
Results. We report the discovery of three new dwarf galaxies in the vicinity of the brightest member of the Sculptor filament, the late-type spiral NGC 253, located at a distance of 3.7 Mpc towards Anti-Virgo. We name them Do II, Do III, and Do IV. Assuming they are companions of NGC 253, their total absolute V-magnitudes fall in the −7 to −9 mag range, which is typical for dwarf satellites in the local Universe. The central surface brightness tends to be extremely low for all three discovered dwarfs and falls roughly in the range of 25−26 mag arcsec−2 in g-band. Using known data on distances and velocities of galaxies, we estimate the total virial mass of the NGC 253 group to be 8 × 10¹¹ M⊙, which gives a virial radius of R200 = 186 kpc and a turn-around radius of 706 kpc. We also discuss the possible existence of a spatially flattened and velocity-correlated satellite system around NGC 253. This large-scale structure is orientated almost edge-on to the line of sight. The possible plane of satellites is only 31 kpc thick with a minor-to-major axis ratio of 0.14. Four out of five galaxies with measured velocities follow a common velocity trend similar to those observed in the planes of satellites around the Andromeda and Centaurus A galaxies. However, the small number of galaxies with known velocities prevents us from reaching a definitive conclusion about the formation scenario of the structure and its possible relation to the surrounding cosmic web.
Key words: galaxies: dwarf / galaxies: groups: individual: NGC 253 / galaxies: photometry
Talentia Senior Fellow.
© ESO 2021
1. Introduction
Dwarf galaxies are rich laboratories for studying stellar populations (Tolstoy 2000; Grebel 2005), galaxy formation scenarios, cosmological models, and gravitational theories (Kroupa et al. 2018). Observations of dwarf galaxies in the Local Group (LG) have presented the standard Λ-Cold-Dark-Matter (ΛCDM) cosmological model with a number of challenges (see e.g., Bullock & Boylan-Kolchin 2017, for a review). Moreover, some recent observational studies indicate that the challenges to ΛCDM appear not to be limited to the LG. Chiboucas et al. (2013) and Müller et al. (2018a) found discs of satellites around M 81 and the Centaurus A galaxy similar to those rotating around the Milky Way (Pawlowski & Kroupa 2013) and M 31 (Ibata et al. 2013); Smercina et al. (2018) and Bennet et al. (2019) reported a missing satellites problem in the M 94 and M 101 groups; and Javanmardi & Kroupa (2020) found an unexpected correlation between the number of satellites and the bulge-to-total baryonic mass ratio extending beyond the LG. These findings require further deep surveys of faint dwarf galaxies around as many massive galaxies in the local volume as possible.
ΛCDM simulations predict that subhalos around more massive host halos, such as that expected to surround the Milky Way, are mostly randomly isotropically distributed and have largely uncorrelated relative velocities. While some anisotropy in distribution and some coherence in motion is expected –induced by the preferential accretion of subhalos along cosmic filaments and in small groups (Libeskind et al. 2011; Pawlowski et al. 2012; Shao et al. 2018)– an overall close-to-isotropic distribution of satellite systems is a robust prediction of the underlying model. This is because the positions and motions of satellites on scales of hundreds of kiloparsecs are not strongly affected by the intricacies of baryonic physics, or the minutiae of how these are implemented in cosmological simulations. Testing this prediction for the phase-space distribution of satellite galaxies has revealed a serious challenge to ΛCDM in the LG: the observed satellite galaxy systems of the Milky Way (Pawlowski & Kroupa 2013) and M 31 (Ibata et al. 2013) display flattened distributions, whose kinematics indicate a preference of satellites to co-orbit along these structures. Recent proper motion data indicate that a substantial fraction of the Milky Way satellites (Fritz et al. 2018; Li et al. 2021), as well as at least two of the on-plane satellites of M 31 (Sohn et al. 2020), indeed orbit along these planes of satellite galaxies. Simulated systems with similar degrees of coherence are exceedingly rare in cosmological simulations (Ibata et al. 2014); for a review, see Pawlowski (2018).
Some similar satellite alignments have been identified outside the LG. The most prominent to date is a flattened distribution of satellites with a close to edge-on orientation, identified around Centaurus A by Tully et al. (2015). To this, Müller et al. (2018a) added evidence for line-of-sight velocity kinematics being consistent with a rotating satellite plane, a finding recently confirmed when additional spectroscopic velocity measurements brought the number of kinematically correlated satellites to 21 out of 28 (Müller et al. 2021). Some additional hints at similar structures exist around other host galaxies such as M 81 (Chiboucas et al. 2013), as well as in a statistical analysis of satellite galaxy pairs (Ibata et al. 2014). Nevertheless, the cosmological challenge posted by the planes of satellite galaxies rests so far on only a small number of studied systems. For a better and statistically more reliable understanding, we need to aim for a more complete census of satellites around other nearby hosts. Systems in the vicinity of the LG are accessible for follow-up measurements of photometric distances and line-of-sight velocities of their members. This allows us to understand their three-dimensional structure and kinematics. Assembling a more complete picture of nearby satellite galaxy systems is thus fundamental in our effort to confirm some proposed formation scenarios for the observed alignments from an observational perspective, an urgently needed addition to complement the (so far) mostly simulation-driven debate.
Ultra-deep imaging in wide sky areas with amateur telescopes (Javanmardi et al. 2016; Romanowsky et al. 2016; Karachentsev et al. 2020) can also help us to complete the census of these hitherto unknown low-surface-brightness (LSB) galaxies. In the last one and half decades, discoveries of dwarf satellites in the LG have been made using stellar density maps of resolved stars, counted in selected areas of the colour-magnitude diagrams (CMDs) from large-scale surveys such as the Sloan Digital Sky Survey (SDSS) (e.g., Willman et al. 2005; Zucker et al. 2006), Pan-STARRs (e.g., Laevens et al. 2015), the Dark Energy Survey (DES) (Dark Energy Survey Collaboration 2016; Bechtol et al. 2015) and, more recently, the DECam Local Volume Exploration Survey (DELVE) (Drlica-Wagner et al. 2021; Mau et al. 2020), the Hyper Suprime-Cam Subaru Strategic Program (HSC-SSP) (Homma et al. 2019), and the DESI Imaging Legacy surveys (Martinez-Delgado et al. 2021a).
In the case of the Milky Way, these diffuse systems are usually found as over-densities of old stellar populations in certain regions of the sky. Contamination by foreground stars and background galaxies makes this task challenging for diffuse systems. However, modern surveys are now routinely finding dwarf galaxies within the virial radius of the Milky Way (∼300 kpc) (see the recent review by Simon 2019, and references therein). The larger distance of the Andromeda galaxy makes it prohibitive to resolve its stellar halo stars fainter than the red clump or horizontal branch level (e.g., PAndAS photometry: Dey et al. 2019). Therefore, the M 31 satellite population can only be traced by observations of the less numerous, bright red giant branch (RGB) stars. This means that hunting for dwarf galaxies in Andromeda is certainly biased because of the insufficient number of stellar tracers for dwarf galaxies with absolute magnitude fainter than about −6 mag, which are barely resolved into stars with ground-based telescopes. In recent years, new-generation large-scale imaging surveys (e.g., the DESI imaging Legacy surveys: Dey et al. 2019) have covered for the first time wide field regions around nearby galaxies in an unprecedentedly low surface-brightness regime (∼28.0−28.5 mag arcsec−2). This opens up the possibility to detect hitherto diffuse dwarf satellites by means of systematic searches based on visual inspection of these public images (e.g., Martinez-Delgado et al. 2021a) or on automatic detection algorithms (e.g., Greco et al. 2018; Tanoglidis et al. 2021; Müller & Schnider 2021; Prole et al. 2021; Haigh et al. 2021).
NGC 253 is one of the closest spirals behind M 31 and is thus a natural place to search for LSB dwarf galaxies that could provide new insights into the presence of satellite planes around nearby galaxies outside the LG. At a distance of ∼3.7 Mpc, this galaxy in the Sculptor group has been explored for satellite galaxies in the past (Cote et al. 1997; Karachentseva & Karachentsev 1998, 2000; Jerjen et al. 1998, 2000; Sand et al. 2014; Toloba et al. 2016). In this paper, we present the discovery of three LSB dwarf galaxies near NGC 253 found by visual inspection of the DES imaging data. Using an updated census of low-mass systems around this galaxy, we address for the first time the issue of the existence of a spatially flattened and velocity-correlated dwarf galaxy system around NGC 253.
2. Searching strategy and data analysis
2.1. Searching strategy
The dwarf galaxy candidates reported in this paper were found by the amateur astronomer Giuseppe Donatiello by visual inspection of the Dark Energy Camera (DECam: Flaugher et al. 2015) images of the Scuptor group of galaxies available from the DESI Legacy Imaging Surveys (Dey et al. 2019). A total number of 13 candidates were detected in a total explored area of 15 × 10°. For this paper, we focus on only three candidates with clear evidence of being partially resolved into stars in the vicinity of NGC 253, as shown in Fig. 1 (left panel). The typical angular resolution of these data (estimated from the seeing of the images) is ∼0.9″. We name them Donatiello II (Do II), Donatiello III (Do III), and Donatiello IV (Do IV), and their position coordinates are given in Table 1. These galaxies were not detected in the automatic search of diffuse stellar systems in the DES data undertaken by Tanoglidis et al. (2021).
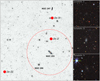 |
Fig. 1. Left panel: position of the three dwarf galaxies (solid red circles) reported in this study with respect to the spiral NGC 253. The red circular line corresponds to the area explored by the PISCes survey (Toloba et al. 2016) extending up to ∼150 kpc from the centre of NGC 253. The total field of view of this image is 450′×480′. Right panel: full colour version of the image cutouts obtained with LEGACYPIPE for Do II, Do III, and Do IV. North is up and east is left. The field of view of all these image cutouts is 3.3′×3.3′. |
GALFIT results for Do II, Do III and Do IV.
2.2. Image cutout data
The DESI Legacy Imaging Surveys compile optical data in three optical bands (g, r, and z) coupled with all-sky infrared imaging from the Wide-field Infrared Survey Explorer (WISE) (Wright et al. 2010; Meisner et al. 2019) and obtained by three different imaging projects on three different telescopes: The DECam Legacy Survey (DECaLS), the Beijing-Arizona Sky Survey (BASS), and the Mayall z-band Legacy Survey (MzLS; Zou et al. 2019; Dey et al. 2019). The DESI Legacy Imaging Survey data releases also include re-reduced public DECam data from the DES (Abbott et al. 2018).
Image cutouts centred on each satellite candidate were subsequently obtained by coadding images of these systems taken by the DES (Dark Energy Survey Collaboration 2016) using the DECam. These data were reprocessed using the LEGACYPIPE software of the DESI Legacy imaging surveys (see e.g., Fig. 2 in Martinez-Delgado et al. 2021b). Briefly, each image is astrometrically calibrated to Gaia-DR2 and photometrically calibrated to the Pan-STARRS PS1 survey, and then resampled to a common pixel grid and summed with inverse-variance weighting. Figure 1 (right panel) shows the resulting coadded image cutouts of the three dwarf galaxies, which include approximately eight exposures in each of g, r, and z-bands. We calculated the nominal depths of the images in the NGC 253 region following the approach by Román et al. (2020). The calculated surface brightness limits are μ = 29.3, 29.0, and 27.7 mag arcsec−2 for the g, r, and z bands respectively measured as 3σ in 10 × 10 arcsec boxes.
2.3. Photometry and structural properties
We use GALFIT software (Peng et al. 2002) to determine the photometry and structural properties of dwarf galaxies following a similar approach to that described in Javanmardi et al. (2016). First, the images of the g, r, and z-bands are combined to increase the signal-to-noise ratio and to perform the first GALFIT modelling. The centre of the galaxy, as well as the Sersic index, axis ratio, position angle, and effective radius are obtained from the combined images and the results are listed in Table 1. In a subsequent step, to stabilise the fitting procedure, these parameters are kept fixed to their best values while fitting the individual band images for measuring the magnitude and surface brightness which are listed in Table 2. Figure 2 shows the results of GALFIT modelling in r-band. The modelling for g and z-bands yields similar visual results, which are therefore not shown here.
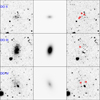 |
Fig. 2. From left to right: dwarf galaxies in r-band, the GALFIT models, and the residual images after subtracting the model. The image scales and min max are the same for all the panels. The same procedure is done for modelling the g and z-band images. We mark the position of a few partially resolved sources in the galaxies that are visible in the residual images with red circles. |
Photometric results for Do II, Do III and Do IV.
Careful inspection of the residual images (which is the result of subtracting the GALFIT model from the data) led to the discovery of a number of unresolved sources that could belong to the dwarf galaxies. Among these unresolved sources, we mark those that pass the conditions r > 24.0 and 0.4 < g − r < 1.2 by red circles.
Using the mTot values and adopting the transformation equation provided by Jester et al. (2005)1V = g − 0.59 × (g − r)−0.01, we obtain the V-band magnitudes. These results are also listed in Table 1. Table 2 shows that the surface brightness of these three stellar system is lower than 25 mag arcsec−2 and thus cannot be detected in the previous photographic and CCD images from large-scale surveys like the POSS-II or PanSTARRs.
3. Discussion
3.1. Distances
The DESI Legacy survey images are not deep enough to build up a colour–magnitude diagram of resolved stellar populations in these dwarf galaxies. Thus, it is not possible to determine their distances from the brightness of the tip of the RGB. Given their close angular distance to NGC 253, we assume that the discovered galaxies are at the same distance as NGC 253, following a similar approach to that used in other recent wide-field surveys of dwarf satellite systems in the local volume (Javanmardi et al. 2016; Carlsten et al. 2020). This is also supported by the degree of resolution of the stars displayed for these new objects when compared with the images of some confirmed dwarf companions of NGC 253 obtained in the same survey (see Fig. 3). In addition, our hypothesis is consistent with the results from a standard approach used to establish membership based on the comparison of morphological and photometric properties with those from known dwarf galaxies (see e.g., Müller et al. 2018b). In Table 1 we list the effective radius (in pc) and absolute magnitude, MV (in mag), by assuming a distance modulus of 27.84 ± 0.02 mag (Jacobs et al. 2009) for NGC 253. Figure 4 shows the distribution of these three dwarf galaxies in the Re versus L, μe versus Re, and μe versus MV planes. The known dwarf galaxies of the Milky Way and Andromeda (McConnachie 2012) are also shown for comparison. As can be seen, the three candidates can be characterised by similar properties to those of the LG dwarf galaxies, supporting our assumption that they could be located at a similar distance to that of NGC 253. However, with the present ground-based data, we cannot completely reject that some of these new dwarfs may be background galaxies projected onto the sky region of the Sculptor group.
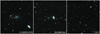 |
Fig. 3. Comparison of the degree of resolution of the stars of Do II in the DES images with the data from the same survey for two confirmed satellites of NGC 253 situated at similar distances (see Table 3): LVJ005−2310 and Scl–MM–Dw1. The field of view of these image cutouts are 4′ × 4′. North is up and east is left. |
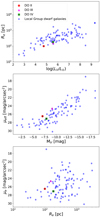 |
Fig. 4. Comparison of the photometric and structural parameters of the three dwarf galaxies reported in this study with those for the Milky Way and M 31 companions. |
3.2. The NGC 253 group of galaxies
The amateur astronomer Giuseppe Donatiello discovered three new dwarf galaxies in the vicinity of the bright late-type spiral NGC 253. This galaxy is the brightest member of the Sculptor filament (Jerjen et al. 1998; Karachentsev et al. 2003) located in the Local Supercluster plane almost in the Anti-Virgo direction. The distribution of galaxies over the sky in the Sculptor filament is shown in the Fig. 5. This region has been intensively studied in a number of H I surveys (see e.g., Bouchard et al. 2005; Westmeier et al. 2017; Koribalski et al. 2018). The systematic searches for dwarf galaxies (Cote et al. 1997; Karachentseva & Karachentsev 1998, 2000; Jerjen et al. 1998, 2000; Sand et al. 2014) revealed a population of galaxies of very low luminosity down to MV ≈ −10 mag. High-precision distances using the tip of the red giant branch (TRGB) were measured by Karachentsev et al. (2003, 2006, 2021), Cannon et al. (2003), Mouhcine et al. (2005), Davidge (2006), Mould & Sakai (2008), Jacobs et al. (2009), Dalcanton et al. (2009), Da Costa et al. (2009), Radburn-Smith et al. (2011), Lianou & Cole (2013), Sand et al. (2014), and Toloba et al. (2016).
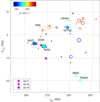 |
Fig. 5. Distribution of galaxies around NGC 253 in a 40° ×40° field in the supergalactic coordinates. The members of the NGC 253 group are shown by filled coloured circles. The background (reddish) and foreground (bluish) galaxies are marked with open circles. The redshift is colour-coded according to the key in the top left corner. Newly discovered objects are shown by magenta polygons. |
The ‘tidal index’ (Karachentsev & Makarov 1999; Karachentsev et al. 2013) gives us a good proxy of group membership; it characterises the degree of the tidal impact from the main disturber (MD) TI ∝ log(LMD/RMD)+C, where LMD is the luminosity of the most influential neighbor and RMD is its spatial separation from the galaxy under consideration. The constant C is chosen so that TI = 0 at the ‘zero-velocity surface’ of the main disturber. Thus, TI > 0 indicates that the galaxy is physically bound to its main disturber, while TI < 0 means that the object belongs to the field. We summarise the information available for the galaxies in the vicinity of NGC 253 in the Table 3. Morphological type, absolute magnitude, and ‘tidal index’ are given according to the current state of the Local Volume database2 (Kaisina et al. 2012). Newly found galaxies are marked in bold. The hierarchy in the group is indicated by the galaxy name and the galaxies are sorted according to the ‘tidal index’ with respect to their main disturber. Data sources on velocities and distances are indicated as footnotes in the table. It should be noted that the velocity of NGC 253, Vh = 261 km s−1, obtained in the deep Parkes H I survey (Westmeier et al. 2017) differs significantly from other measurements. For instance, the HIPASS Bright Galaxy Catalog (Koribalski et al. 2004) gives a systemic velocity Vh = 243 ± 2 km s−1. Lucero et al. (2015) measure the velocity of the kinematical centre of the galaxy of Vh = 238 ± 4 km s−1 using H I radio-interferometric observations with the Karoo Array Telescope. However, to avoid possible systematic errors, we decided to use the value from the deep Parkes H I survey (Westmeier et al. 2017), because most velocity measurements around NGC 253 were taken from this survey. We note that the choice of one or another velocity of NGC 253 has almost no effect on the estimate of the total mass of the group.
Galaxies in the vicinity of NGC 253.
Most galaxies in the Sculptor filament have precise TRGB distances, which allows us to map the 3D distribution of matter in this region. The projections of the spatial distribution of galaxies on the plane of the Local Supercluster and on the perpendicular plane are shown in the Fig. 6. There are currently 12 confirmed members in the group around NGC 253. Taking into account three new probable members and Sculptor SR, for which there are no velocity or distance measurements, the total population consist of 16 galaxies. Nine of these have known radial velocities, allowing the radial velocity dispersion in the NGC 253 group to be estimated to 43 km s−1. Most galaxies lie at a projection distance of less than 5.5° or about 350 kpc from NGC 253. In projection, Do II is the third nearest satellite of NGC 253. NGC 247 has high negative peculiar velocity of −86 km s−1 with respect to NGC 253. Moreover, Do IV together with ESO 540−032 form a subgroup around NGC 247. Do III, lying at a projected distance of about 340 kpc from NGC 253, is one of the peripheral members of the core of the group. Galaxies NGC 7793 with its companions PGC 704814 and ESO 349−031 are located near the border of the system. These galaxies are just falling into the group centre and therefore cannot be used for the virial mass estimation. Other galaxies beyond 1 Mpc from NGC 253 participate in a general Hubble expansion, which allowed Karachentsev et al. (2003) to determine the zero-velocity radius of the group to be 0.7 Mpc.
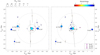 |
Fig. 6. Map of galaxies in the vicinity of NGC 253 in the supergalactic coordinates. Left-hand panel: XY-projection on the supergalactic plane, while right-hand panel: edge-on view of the Local Supercluster ‘pancake’. The sizes and colours of the dots correspond to the absolute B-band magnitude and morphology of galaxies, following the keys at the top. The line segments indicate uncertainties in the distance estimations. Large circles around NGC 253 mark the virial zone, R200 ≈ 190 kpc, and the zero velocity surface, R0 ≈ 700 kpc. The magenta symbols indicate the expected position of the discovered galaxies. |
The starburst galaxy NGC 253 dominates the group. Its absolute magnitude is 2.6 mag less (in other words, 11 times brighter) than that of the second-brightest galaxy NGC 247. This allows us to use the virial theorem and the projected mass estimator in the simplest form of the test particles around a massive body (Bahcall & Tremaine 1981). Using the first five satellites of NGC 253 with known velocities (LV J0055−2310 + NGC 247 + ESO 540−032 + DDO 6 +KDG 2), we estimate the virial mass of the group to be Mvir = 6.4 × 10¹¹ M⊙. The projected mass estimator, assuming isotropic orbits distribution  , gives a similar value of Mpm = 7.1 × 10¹¹ M⊙. As noted above, these values are almost independent of the adopted velocity of NGC 253. In the case of a heliocentric radial velocity of Vh = 243 ± 2 (Koribalski et al. 2004), the corresponding values are Mvir = 6.2 × 10¹¹ and Mpm = 6.8 × 10¹¹ M⊙. Taking into account the fact that KDG 2, lying at a distance of more than 460 kpc, is most likely located outside the virial radius and excluding it from the analysis, for the four remaining satellites we obtain Mvir = 7.3 × 10¹¹ and Mpm = 8.8 × 10¹¹ M⊙. Therefore, adopting a total mass for the NGC 253 group of about 8 × 10¹¹ M⊙, one can estimate the radius of the virialized region of R200 = 186 kpc, which corresponds to a sphere whose density is 200 times greater than the critical one. According to an exact analytical solution (Baushev 2019), the corresponding radius of the zero-velocity surface is 706 kpc. This value is in excellent agreement with the direct measurement of the zero-velocity radius of 0.7 Mpc by Karachentsev et al. (2003).
3.3. A plane of satellite galaxies?
The presence of spatially flattened and velocity-correlated satellite galaxy systems around the Milky Way, M 31, and Centaurus A motivates the question: Is there evidence for a similar alignment among the satellites of NGC 253?
Figure 7 shows the on-sky distribution of the galaxies listed in Table 3, with the galaxies colour-coded by their line-of-sight velocity component relative to the NGC 253 velocity. It is apparent from this figure that most of the known objects in the vicinity of NGC 253 align in an extremely narrow structure to the north. Of the 11 galaxies potentially within 600 kpc of NGC 253 (indicated by yellow boxes), only Do III and Sculptor SR are significantly offset from this orientation. Neither of these two have measured distances, and so they could well be foreground or background objects outside of the system.
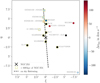 |
Fig. 7. On-sky distribution of the galaxies listed in Table 3 in equatorial coordinates relative to the position of NGC 253 (black cross). The galaxies are colour-coded according to their line-of-sight velocity component relative to the NGC 253 velocity. Galaxies without velocity measurements are plotted in black. Galaxies (potentially) within 600 kpc of NGC 253 are marked with yellow boxes. The dashed black line indicates the on-sky orientation of the flattening of these objects. |
This asymmetric distribution of galaxies with respect to the NGC 253 cannot be explained simply by the observational biases. The group is located near the south Galactic pole, where the Galactic extinction is insignificant. A simple count of galaxies in a 30-degree cone around NGC 253 using the HyperLeda database (Makarov et al. 2014) shows that the redshift data are 97% complete down to BT = 15.5 and 86% complete down to BT = 16.6 mag. Therefore, we believe that we know the velocities of all possible satellites in the group with MB ≲ −12.3 mag. Table 3 confirms this estimate. The only satellites without redshift measurements are dSph galaxies fainter than MB = −11 mag. The hunt for more faint galaxies of extremely low surface brightness without gas is an extremely difficult task, and our knowledge of the faint end of the galaxy luminosity function is highly incomplete below MB ∼ −11 mag. However, the brighter galaxies also show a similar spatial distribution that appears to reflect the real structure of the group.
Of the 11 galaxies possibly within 600 kpc of NGC 253, 8 are in the north and only 3 are in the south, and the asymmetry increases to 6 in the north and only 1 in the south if the 4 galaxies without distance measurements are excluded. The distribution of known galaxies around NGC 253 is therefore strongly lopsided. While the asymmetry appears to be quite extreme in this case, lopsided distributions of galaxies around a host appear to be rather common: they have been found for the distribution of satellite galaxies around M 31 (Conn et al. 2013), in statistical samples of both paired (Libeskind et al. 2016) and isolated galaxies (Brainerd & Samuels 2020), and even in cosmological simulations (Pawlowski et al. 2017; Wang et al. 2021).
It is intriguing that of the five galaxies with line-of-sight velocities, all of which align along the flattened structure to the north of NGC 253, four are blueshifted and only one is redshifted relative to NGC 253. This is highly consistent with an interpretation as a mostly rotating satellite plane like those seen in M 31 and Centaurus A. In fact, a fraction of 80% correlated velocities is very similar to the fractions of correlated velocities reported for M 31 (13 out of 15, or 86%) by Ibata et al. (2013), and for Centaurus A (21 out of 28, or 75%) by Müller et al. (2021). However, due to the small number of objects, the degree of correlation for the NGC 253 system is not significant. Finding a velocity coherence of at least four out of five happens in 37.5% of all cases. A larger number of galaxies with measured velocities will therefore be required for a statistically meaningful analysis, demonstrating an urgent need for spectroscopic follow-up of candidate dwarf galaxies in this region.
To study the 3D distribution of the known satellites of NGC 253, we employ the common tensor-of-inertia (ToI) fitting method (see e.g., Pawlowski et al. 2015). We account for the uncertainties in the distance measurements by generating 1000 realisations of the observed system, drawing galaxy distances from normal distributions that are centred on their most likely value and have errors of a 1σ in width, as compiled in Table 3. We consider all galaxies within 600 kpc, excluding the four candidates without measured distances (Do II, III, IV and Sculptor SR). The results of our plane fits are compiled in Fig. 8. As expected from the flattened on-sky distribution, we find an extremely narrow spatial alignment: the root-mean-square (rms) height from the best-fit plane is only Δrms = 31 ± 5 kpc, and the minor-to-major axis ratio is c/a = 0.14 ± 0.03. These values are comparable to those of the satellite planes around the Milky Way (Δrms = 20 to 30 kpc, c/a ≈ 0.2) and M 31 (Δrms < 14.1 kpc, c/a ≈ 0.1). The normal direction to the best-fit plane is shown in Fig. 9. It points to supergalactic coordinates (lSG, bSG) = (12° , − 73° ), and varies by only 4° around this direction. The plane has an inclination of i = 85°, and is thus seen very close to edge-on – as is the case for the M 31 and Centaurus A satellite structures. The good alignment with the supergalactic plane could be related to the preference of flattened satellite galaxy structures in the Local Universe to align with the direction of greatest collapse of their surrounding larger-scale structure (Libeskind et al. 2019). This could also explain the preference to see these structures edge-on (as both the Milky Way and the nearby hosts lie in a common sheet-like structure). Indeed, as shown in Fig. 9, the plane normal is closely aligned with the e1-direction to within (16.6 ± 5.4)°, where e1 is the eigenvectors of the tidal tensor at the position of NGC 253 which corresponds to the axis along which material in the cosmic web is compressed fastest. NGC 253 therefore further confirms the finding by Libeskind et al. (2018) that some flattened dwarf galaxy structures in the Local Universe preferentially align with the e1-direction at their respective positions, and thus appear to be related to the larger-scale cosmic web.
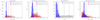 |
Fig. 8. Best-fit parameters for the ToI fits to the spatial distributions of galaxies within 600 kpc of NGC 253. Shown from left to right are: the absolute rms plane height Δrms, the relative minor-to-major axis ratio c/a, the inclination i of the best-fit plane with the line of sight to NGC 253, and the perpendicular offset dNGC 253 of the best-fit plane from the host galaxy NGC 253 (which was not included in the plane fit). Each panel also gives the mean and standard deviations of the shown distributions. The realisations drawing from the observed galaxy distances (blue) are much more flattened (by both measures) than the randomised samples (grey) drawn from isotropic distributions around the position of NGC 253 but following the same radial distances. Satellite systems drawn from the Illustris TNG 100 simulation (red) are more flattened than isotropic distributions in both absolute plane height and axis ratio, but the observed system falls onto the more flattened tail of their distribution. |
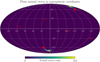 |
Fig. 9. Density distribution of the direction of plane-normal vectors (minor axis of 3D galaxy distribution) of the galaxies with measured distances within 600 kpc around NGC 253, for 1000 realisations drawn from the distance errors. Shown are supergalactic coordinates, indicating that the best-fit plane aligns closely with the Supergalactic plane. The red symbols indicate the eigenvectors of the tidal tensor at the position of NGC 253, which describe the principal directions of the surrounding cosmic web. The best-fit plane is well aligned with e1, the axis along which material in the cosmic web is compressed fastest. |
To assess the significance of the found flattening compared to completely random, uncorrelated distributions, we repeated the plane-fitting on randomised systems. These are drawn from an isotropic distribution centred on NGC 253, but follow the exact same radial distances from the host as our observed realisations (grey histograms in the Fig. 8). The isotropic distributions typically result in much wider plane fits, and the flattenings measured for the observed system are off by 2σ for both the absolute plane height and the relative axis ratios. Thus, while not highly significant – which is expected given the small number of objects – it is still an intriguing alignment that warrants further study of this system’s phase-space correlation, in particular via distance measurements of other satellite galaxy candidates to assess their association with NGC 253.
While a detailed comparison to cosmological expectations is beyond the scope of the present work, we nevertheless illustrate the expected flattening of satellite galaxy systems in ΛCDM by comparing to systems in the Illustris TNG-100 hydrodynamical cosmological simulation (Springel et al. 2018; Nelson et al. 2019). As analogues, we select host galaxies with virial masses in the range of 0.6 − 1.0 × 10¹² M⊙, which are required to be sufficiently isolated by rejecting all hosts that have another galaxy with a virial mass exceeding 0.5 × 10¹² M⊙ within 1.2 Mpc. The galaxies within a volume of 600 kpc around each host are ranked based on their brightness (if they contain stars), followed by a ranking by mass (if they are dark). The flattening of the seven top-ranked galaxies (excluding the host) is measured, and the resulting distribution of absolute plane height, relative axis ratio, and the offset of the best-fit plane from the that of host are plotted in red in Fig. 8.
As expected, the ΛCDM satellite systems are more flattened than systems drawn from isotropy (especially because the considered volume exceeds the virial volume of the simulated hosts). However, the observed distribution of galaxies around NGC 253 remains on the more flattened tail of the distribution: only  and
and  % of the simulated systems are more flattened than the observed system in c/a and Δrms, respectively (where the error bars are based on the standard deviations obtained from the Monte-Carlo sampling of the observed distribution). The flattened distribution of the presently confirmed galaxies in the vicinity of NGC 253 therefore does not rise to the same degree of tension reported for the better-studied satellite galaxy planes around the Milky Way, M 31, and Centaurus A.
However, if only one additional satellite were confirmed without changing the overall measured flattening of the system, then the fractions reported above would already drop by about a factor of two, that is, to  and
and  % of simulated systems being more flattened in c/a and Δrms, respectively. This demonstrates the requirement for a more complete census of galaxies around NGC 253 via distance measurements of the current candidates, as well as a more complete sample of spectroscopic velocity measurements, in order to clarify whether the system is exceptional or rather typical compared to expectations derived from cosmological simulations.
If we assume that the galaxies (including our new three discoveries) for which no distance measurement exist are at the distance of NGC 253, with a broad distance uncertainty of ±200 kpc, our plane fits become less extreme. The broad assumed distance uncertainties also introduce a lot of scatter in the obtained best-fit parameters. While the best-fit orientation changes only mildly, the plane width is then dominated by the two spatial outliers Do III and Sculptor SR.
While one can interpret the spatial alignment as a potential plane of satellite galaxies, its extent of 600 kpc exceeds the virial volume of NGC 253. This makes the structure more similar to the larger-scale planes of dwarf galaxies discovered in the LG, which have diameters of 1−2 Mpc (Pawlowski et al. 2013). However, even the six galaxies (assuming those without distance measurements share the same distance as NGC 253) within 300 kpc are roughly aligned in the same direction as the objects on larger scales. Another interpretation of the larger structure is that these galaxies trace a cosmic filament. Preferential accretion of dwarf galaxies along filaments was proposed as a possible origin of flattened satellite galaxy structures (Lovell et al. 2011; Libeskind et al. 2011). While the alignment of the flattened galaxy distribution with the direction of fastest collapse of the surrounding cosmic web can be seen as support of such an interpretation, the observed distribution appears much more narrow than a typical filament in cosmological simulations, and the resulting satellite galaxy systems in simulations are typically not highly anisotropic (Pawlowski et al. 2012; Shao et al. 2018). However, as the effects of accretion along filaments on the formation of satellite alignments have thus far mostly been studied in cosmological simulations, NGC 253 promises to be a unique observational test case of the filamentary accretion scenario: a potential satellite plane in the making by the cosmic web.
4. Conclusions
In this study, we report the discovery of three dwarf spheroidal galaxies, named Do II, Do III, and Do IV, in the vicinity of the bright late-type spiral NGC 253 galaxy by means of visual inspection of the images taken by the DES. For our analysis, the images were processed using the LEGACYPIPE software from the DESI Legacy imaging surveys. We used the GALFIT software to derive their photometric and structural properties. The physical parameters for Do II, Do III, and Do IV were calculated by adopting a distance modulus of 27.84 ± 0.02 mag for NGC 253 (Jacobs et al. 2009). The resulting total absolute magnitudes of the dwarfs transformed to the V-band fall in the range from about −7 to about −9 mag, which are typical for satellite dwarf galaxies in the Local Universe. The central surface brightness tends to be extremely low for all the discovered dwarfs and falls roughly in the range of 25−26 mag arcsec−2 in g-band.
So far, there are 12 confirmed members in the group around NGC 253. Taking into account these three possible new members and the Sculptor SR dwarf galaxy, the total population consists of 16 galaxies. The radial velocity dispersion in the NGC 253 group estimated using the nine members with known radial velocities is 43 km s−1. Most galaxies lie at a projected distance of less than 5.5° or about 350 kpc from NGC 253. Do II is the third nearest satellite to NGC 253 in projection. The late spiral galaxy NGC 247 has a highly negative, peculiar velocity of −86 km s−1 with respect to NGC 253. Furthermore, Do IV together with the dwarf irregular galaxy ESO 540−032 forms a subgroup around NGC 247. Do III, lying at a distance of about 340 kpc from NGC 253, is one of the peripheral members of the core of the group.
We used the virial theorem and the projected mass estimator to determine the galaxy group mass. We estimated the total mass of the NGC 253 group to be about 8 × 10¹¹ M⊙. Therefore, the respective estimated radius of the virialised region is R200 = 186 kpc, and the corresponding radius of the zero-velocity surface is 706 kpc.
We also discuss the issue of the possible existence of a spatially flattened and velocity-correlated satellite galaxy system around NGC 253. It is apparent from our analysis that most of the known objects in the vicinity of NGC 253 are aligned in an extremely narrow structure to the north side of the galaxy. Of the 12 galaxies potentially within 600 kpc from NGC 253, only Do III and Sculptor SR are significantly offset from this orientation.
To study the three-dimensional distribution of the known satellites of NGC 253, we employed the common tensor-of-inertia fitting method. As expected from a flattened on-sky distribution, we find an extremely narrow spatial alignment: the root-mean-square (rms) height from the best-fit plane is only Δrms = 31 ± 5 kpc, and the minor-to-major axis ratio is c/a = 0.14 ± 0.03. These values are comparable with those of the satellite planes found around the Milky Way and M 31. While one can interpret this alignment as a potential plane of satellite galaxies, its extension of 600 kpc exceeds the virial volume of NGC 253. This makes the structure more similar to the larger-scale planes of dwarf galaxies discovered in the LG, which have diameters of 1−2 Mpc (Pawlowski et al. 2013).
The first results of our survey of dwarf galaxies around NGC 253 and the recent discovery of a possible very faint satellite of M 33 (Martinez-Delgado et al. 2021a) demonstrate the suitability of DESI Legacy surveys imaging for discovering diffuse satellites of nearby spiral galaxies by means of visual inspection of the images. Because of the low surface brightness of the three dwarf galaxies reported here, their association with NGC 253 can only be confirmed with TRGB estimates in CMDs from deeper HST data and ground-based 8 m telescopes, or, alternatively, radial velocities obtained with state-of-the-art spectroscopic instruments (e.g., Müller et al. 2021).
Acknowledgments
We thank the referee for giving constructive comments which substantially helped improving this paper. We also thank Noam Libeskind, Martha Haynes and Lister Staveley-Smith for useful comments. DMD acknowledges financial support from the Talentia Senior Program (through the incentive ASE-136) from Secretaría General de Universidades, Investigación y Tecnología, de la Junta de Andalucía. DMD also acknowledges funding from the State Agency for Research of the Spanish MCIU through the “Center of Excellence Severo Ochoa” award to the Instituto de Astrofísica de Andalucía (SEV-2017-0709). MSP thanks the Klaus Tschira Stiftung and German Scholars Organization for support via a KT Boost Fund. JR acknowledge financial support from the grants AYA2015-65973-C3-1-R and RTI2018-096228-B-C31 (MINECO/FEDER, UE) as well as support from the State Research Agency (AEI-MCINN) of the Spanish Ministry of Science and Innovation under the grant “The structure and evolution of galaxies and their central regions” with reference PID2019-105602GB-I00/10.13039/501100011033. We acknowledge the usage of the HyperLeda database (http://leda.univ-lyon1.fr) (Makarov et al. 2014). This project used public archival data from the Dark Energy Survey. Funding for the DES Projects has been provided by the US Department of Energy, the US National Science Foundation, the Ministry of Science and Education of Spain, the Science and Technology Facilities Council of the United Kingdom, the Higher Education Funding Council for England, the National Center for Supercomputing Applications at the University of Illinois at Urbana-Champaign, the Kavli Institute of Cosmological Physics at the University of Chicago, the Center for Cosmology and Astro-Particle Physics at the Ohio State University, the Mitchell Institute for Fundamental Physics and Astronomy at Texas A&M University, Financiadora de Estudos e Projetos, Fundação Carlos Chagas Filho de Amparo à Pesquisa do Estado do Rio de Janeiro, Conselho Nacional de Desenvolvimento Científico e Tecnológico and the Ministério da Ciência, Tecnologia e Inovação, the Deutsche Forschungsgemeinschaft, and the Collaborating Institutions in the Dark Energy Survey. The Collaborating Institutions are Argonne National Laboratory, the University of California at Santa Cruz, the University of Cambridge, Centro de Investigaciones Energéticas, Medioambientales y Tecnológicas-Madrid, the University of Chicago, University College London, the DES-Brazil Consortium, the University of Edinburgh, the Eidgenössische Technische Hochschule (ETH) Zürich, Fermi National Accelerator Laboratory, the University of Illinois at Urbana-Champaign, the Institut de Ciències de l’Espai (IEEC/CSIC), the Institut de Física d’Altes Energies, Lawrence Berkeley National Laboratory, the Ludwig-Maximilians Universität München and the associated Excellence Cluster Universe, the University of Michigan, the National Optical Astronomy Observatory, the University of Nottingham, The Ohio State University, the OzDES Membership Consortium, the University of Pennsylvania, the University of Portsmouth, SLAC National Accelerator Laboratory, Stanford University, the University of Sussex, and Texas A&M University. Based in part on observations at Cerro Tololo Inter-American Observatory, National Optical Astronomy Observatory, which is operated by the Association of Universities for Research in Astronomy (AURA) under a cooperative agreement with the National Science Foundation.
References
- Abbott, T. M. C., Abdalla, F. B., Allam, S., et al. 2018, ApJS, 239, 18 [Google Scholar]
- Bahcall, J. N., & Tremaine, S. 1981, ApJ, 244, 805 [NASA ADS] [CrossRef] [Google Scholar]
- Baushev, A. N. 2019, MNRAS, 490, L38 [CrossRef] [Google Scholar]
- Bechtol, K., Drlica-Wagner, A., Balbinot, E., et al. 2015, ApJ, 807, 50 [NASA ADS] [CrossRef] [Google Scholar]
- Bennet, P., Sand, D. J., Crnojević, D., et al. 2019, ApJ, 885, 153 [NASA ADS] [CrossRef] [Google Scholar]
- Bouchard, A., Jerjen, H., Da Costa, G. S., & Ott, J. 2005, AJ, 130, 2058 [NASA ADS] [CrossRef] [Google Scholar]
- Brainerd, T. G., & Samuels, A. 2020, ApJ, 898, L15 [CrossRef] [Google Scholar]
- Bullock, J. S., & Boylan-Kolchin, M. 2017, ARA&A, 55, 343 [NASA ADS] [CrossRef] [Google Scholar]
- Cannon, J. M., Dohm-Palmer, R. C., Skillman, E. D., et al. 2003, AJ, 126, 2806 [NASA ADS] [CrossRef] [Google Scholar]
- Carlsten, S. G., Greco, J. P., Beaton, R. L., & Greene, J. E. 2020, ApJ, 891, 144 [CrossRef] [Google Scholar]
- Chiboucas, K., Jacobs, B. A., Tully, R. B., & Karachentsev, I. D. 2013, AJ, 146, 126 [Google Scholar]
- Colless, M., Peterson, B. A., Jackson, C., et al. 2003, ArXiv e-prints [arXiv:astro-ph/0306581] [Google Scholar]
- Conn, A. R., Lewis, G. F., Ibata, R. A., et al. 2013, ApJ, 766, 120 [CrossRef] [Google Scholar]
- Cote, S., Freeman, K. C., Carignan, C., & Quinn, P. J. 1997, AJ, 114, 1313 [NASA ADS] [CrossRef] [Google Scholar]
- Da Costa, G. S., Grebel, E. K., Jerjen, H., Rejkuba, M., & Sharina, M. E. 2009, AJ, 137, 4361 [NASA ADS] [CrossRef] [MathSciNet] [Google Scholar]
- Dalcanton, J. J., Williams, B. F., Seth, A. C., et al. 2009, ApJS, 183, 67 [Google Scholar]
- Dark Energy Survey Collaboration (Abbott, T., et al.) 2016, MNRAS, 460, 1270 [Google Scholar]
- Davidge, T. J. 2006, ApJ, 641, 822 [NASA ADS] [CrossRef] [Google Scholar]
- Dey, A., Schlegel, D. J., Lang, D., et al. 2019, AJ, 157, 168 [NASA ADS] [CrossRef] [Google Scholar]
- Drlica-Wagner, A., Carlin, J. L., Nidever, D. L., et al. 2021, AAS J., submitted [arXiv:2103.07476] [Google Scholar]
- Flaugher, B., Diehl, H. T., Honscheid, K., et al. 2015, AJ, 150, 150 [Google Scholar]
- Fritz, T. K., Battaglia, G., Pawlowski, M. S., et al. 2018, A&A, 619, A103 [NASA ADS] [CrossRef] [EDP Sciences] [Google Scholar]
- Grebel, E. K. 2005, in Stellar Astrophysics with the World’s Largest Telescopes, eds. J. Mikolajewska, & A. Olech, AIP Conf. Ser., 752, 161 [Google Scholar]
- Greco, J. P., Greene, J. E., Strauss, M. A., et al. 2018, ApJ, 857, 104 [NASA ADS] [CrossRef] [Google Scholar]
- Haigh, C., Chamba, N., Venhola, A., et al. 2021, A&A, 645, A107 [CrossRef] [EDP Sciences] [Google Scholar]
- Homma, D., Chiba, M., Komiyama, Y., et al. 2019, PASJ, 71, 94 [NASA ADS] [CrossRef] [Google Scholar]
- Ibata, R. A., Lewis, G. F., Conn, A. R., et al. 2013, Nature, 493, 62 [CrossRef] [Google Scholar]
- Ibata, R. A., Ibata, N. G., Lewis, G. F., et al. 2014, ApJ, 784, L6 [NASA ADS] [CrossRef] [Google Scholar]
- Jacobs, B. A., Rizzi, L., Tully, R. B., et al. 2009, AJ, 138, 332 [NASA ADS] [CrossRef] [MathSciNet] [Google Scholar]
- Javanmardi, B., & Kroupa, P. 2020, MNRAS, 493, L44 [CrossRef] [Google Scholar]
- Javanmardi, B., Martinez-Delgado, D., Kroupa, P., et al. 2016, A&A, 588, A89 [NASA ADS] [CrossRef] [EDP Sciences] [Google Scholar]
- Jerjen, H., Freeman, K. C., & Binggeli, B. 1998, AJ, 116, 2873 [NASA ADS] [CrossRef] [Google Scholar]
- Jerjen, H., Binggeli, B., & Freeman, K. C. 2000, AJ, 119, 593 [NASA ADS] [CrossRef] [Google Scholar]
- Jester, S., Schneider, D. P., Richards, G. T., et al. 2005, AJ, 130, 873 [Google Scholar]
- Kaisina, E. I., Makarov, D. I., Karachentsev, I. D., & Kaisin, S. S. 2012, Astrophys. Bull., 67, 115 [NASA ADS] [CrossRef] [Google Scholar]
- Karachentseva, V. E., & Karachentsev, I. D. 1998, A&AS, 127, 409 [NASA ADS] [CrossRef] [EDP Sciences] [Google Scholar]
- Karachentseva, V. E., & Karachentsev, I. D. 2000, A&AS, 146, 359 [NASA ADS] [CrossRef] [EDP Sciences] [Google Scholar]
- Karachentsev, I. D., & Makarov, D. A. 1996, AJ, 111, 794 [NASA ADS] [CrossRef] [Google Scholar]
- Karachentsev, I. D., & Makarov, D. I. 1999, in Galaxy Interactions at Low and High Redshift, eds. J. E. Barnes, & D. B. Sanders, 186, 109 [CrossRef] [Google Scholar]
- Karachentsev, I. D., Grebel, E. K., Sharina, M. E., et al. 2003, A&A, 404, 93 [NASA ADS] [CrossRef] [EDP Sciences] [Google Scholar]
- Karachentsev, I. D., Dolphin, A., Tully, R. B., et al. 2006, AJ, 131, 1361 [NASA ADS] [CrossRef] [Google Scholar]
- Karachentsev, I. D., Makarov, D. I., & Kaisina, E. I. 2013, AJ, 145, 101 [NASA ADS] [CrossRef] [Google Scholar]
- Karachentsev, I. D., Neyer, F., Späni, R., & Zilch, T. 2020, Astron. Nachr., 341, 1037 [CrossRef] [Google Scholar]
- Karachentsev, I. D., Tully, R. B., Anand, G. S., Rizzi, L., & Shaya, E. J. 2021, AJ, 161, 205 [CrossRef] [Google Scholar]
- Koribalski, B. S., Staveley-Smith, L., Kilborn, V. A., et al. 2004, AJ, 128, 16 [NASA ADS] [CrossRef] [Google Scholar]
- Koribalski, B. S., Wang, J., Kamphuis, P., et al. 2018, MNRAS, 478, 1611 [NASA ADS] [CrossRef] [Google Scholar]
- Kroupa, P., Haghi, H., Javanmardi, B., et al. 2018, Nature, 561, E4 [CrossRef] [Google Scholar]
- Laevens, B. P. M., Martin, N. F., Bernard, E. J., et al. 2015, ApJ, 813, 44 [NASA ADS] [CrossRef] [Google Scholar]
- Li, H., Hammer, F., Babusiaux, C., et al. 2021, ApJ, submitted [arXiv:2104.03974] [Google Scholar]
- Lianou, S., & Cole, A. A. 2013, A&A, 549, A47 [NASA ADS] [CrossRef] [EDP Sciences] [Google Scholar]
- Libeskind, N. I., Knebe, A., Hoffman, Y., et al. 2011, MNRAS, 411, 1525 [NASA ADS] [CrossRef] [Google Scholar]
- Libeskind, N. I., Guo, Q., Tempel, E., & Ibata, R. 2016, ApJ, 830, 121 [NASA ADS] [CrossRef] [Google Scholar]
- Libeskind, N. I., van de Weygaert, R., Cautun, M., et al. 2018, MNRAS, 473, 1195 [NASA ADS] [CrossRef] [Google Scholar]
- Libeskind, N. I., Carlesi, E., Müller, O., et al. 2019, MNRAS, 490, 3786 [CrossRef] [Google Scholar]
- Lovell, M. R., Eke, V. R., Frenk, C. S., & Jenkins, A. 2011, MNRAS, 413, 3013 [NASA ADS] [CrossRef] [Google Scholar]
- Lucero, D. M., Carignan, C., Elson, E. C., et al. 2015, MNRAS, 450, 3935 [NASA ADS] [CrossRef] [Google Scholar]
- Makarov, D., Prugniel, P., Terekhova, N., Courtois, H., & Vauglin, I. 2014, A&A, 570, A13 [CrossRef] [EDP Sciences] [Google Scholar]
- Martinez-Delgado, D., Karim, N., Boschin, W., et al. 2021a, MNRAS, submitted [arXiv:2104.03859] [Google Scholar]
- Martinez-Delgado, D., Cooper, A. P., Roman, J., et al. 2021b, ArXiv e-prints [arXiv:2104.06071] [Google Scholar]
- Mau, S., Cerny, W., Pace, A. B., et al. 2020, ApJ, 890, 136 [CrossRef] [Google Scholar]
- McConnachie, A. W. 2012, AJ, 144, 4 [Google Scholar]
- Meisner, A. M., Lang, D., Schlafly, E. F., & Schlegel, D. J. 2019, PASP, 131, 124504 [CrossRef] [Google Scholar]
- Mouhcine, M., Ferguson, H. C., Rich, R. M., Brown, T. M., & Smith, T. E. 2005, ApJ, 633, 810 [NASA ADS] [CrossRef] [Google Scholar]
- Mould, J., & Sakai, S. 2008, ApJ, 686, L75 [NASA ADS] [CrossRef] [Google Scholar]
- Müller, O., & Schnider, E. 2021, Open J. Astrophys., 4, 3 [Google Scholar]
- Müller, O., Pawlowski, M. S., Jerjen, H., & Lelli, F. 2018a, Science, 359, 534 [NASA ADS] [CrossRef] [Google Scholar]
- Müller, O., Jerjen, H., & Binggeli, B. 2018b, A&A, 615, A105 [NASA ADS] [CrossRef] [EDP Sciences] [Google Scholar]
- Müller, O., Pawlowski, M. S., Lelli, F., et al. 2021, A&A, 645, L5 [CrossRef] [EDP Sciences] [Google Scholar]
- Nelson, D., Springel, V., Pillepich, A., et al. 2019, Comput. Astrophys. Cosmol., 6, 2 [Google Scholar]
- Pawlowski, M. S. 2018, Mod. Phys. Lett. A, 33, 1830004 [NASA ADS] [CrossRef] [Google Scholar]
- Pawlowski, M. S., & Kroupa, P. 2013, MNRAS, 435, 2116 [NASA ADS] [CrossRef] [Google Scholar]
- Pawlowski, M. S., Kroupa, P., Angus, G., et al. 2012, MNRAS, 424, 80 [NASA ADS] [CrossRef] [Google Scholar]
- Pawlowski, M. S., Kroupa, P., & Jerjen, H. 2013, MNRAS, 435, 1928 [NASA ADS] [CrossRef] [Google Scholar]
- Pawlowski, M. S., Famaey, B., Merritt, D., & Kroupa, P. 2015, ApJ, 815, 19 [NASA ADS] [CrossRef] [Google Scholar]
- Pawlowski, M. S., Ibata, R. A., & Bullock, J. S. 2017, ApJ, 850, 132 [NASA ADS] [CrossRef] [Google Scholar]
- Peng, C. Y., Ho, L. C., Impey, C. D., & Rix, H.-W. 2002, AJ, 124, 266 [Google Scholar]
- Prole, D. J., van der Burg, R. F. J., Hilker, M., & Spitler, L. R. 2021, MNRAS, 500, 2049 [CrossRef] [Google Scholar]
- Radburn-Smith, D. J., de Jong, R. S., Seth, A. C., et al. 2011, ApJS, 195, 18 [Google Scholar]
- Román, J., Trujillo, I., & Montes, M. 2020, A&A, 644, A42 [CrossRef] [EDP Sciences] [Google Scholar]
- Romanowsky, A. J., Martínez-Delgado, D., Martin, N. F., et al. 2016, MNRAS, 457, L103 [NASA ADS] [CrossRef] [Google Scholar]
- Sand, D. J., Crnojević, D., Strader, J., et al. 2014, ApJ, 793, L7 [NASA ADS] [CrossRef] [Google Scholar]
- Shao, S., Cautun, M., Frenk, C. S., et al. 2018, MNRAS, 476, 1796 [CrossRef] [Google Scholar]
- Simon, J. D. 2019, ARA&A, 57, 375 [NASA ADS] [CrossRef] [Google Scholar]
- Smercina, A., Bell, E. F., Price, P. A., et al. 2018, ApJ, 863, 152 [NASA ADS] [CrossRef] [Google Scholar]
- Sohn, S. T., Patel, E., Fardal, M. A., et al. 2020, ApJ, 901, 43 [CrossRef] [Google Scholar]
- Springel, V., Pakmor, R., Pillepich, A., et al. 2018, MNRAS, 475, 676 [NASA ADS] [CrossRef] [Google Scholar]
- Tanoglidis, D., Drlica-Wagner, A., Wei, K., et al. 2021, ApJS, 252, 18 [Google Scholar]
- Toloba, E., Sand, D. J., Spekkens, K., et al. 2016, ApJ, 816, L5 [NASA ADS] [CrossRef] [Google Scholar]
- Tolstoy, E. 2000, ArXiv e-prints [arXiv:astro-ph/0010028] [Google Scholar]
- Tully, R. B., Libeskind, N. I., Karachentsev, I. D., et al. 2015, ApJ, 802, L25 [Google Scholar]
- Wang, P., Libeskind, N. I., Pawlowski, M. S., et al. 2021, ApJ, 914, 78 [CrossRef] [Google Scholar]
- Westmeier, T., Obreschkow, D., Calabretta, M., et al. 2017, MNRAS, 472, 4832 [CrossRef] [Google Scholar]
- Willman, B., Dalcanton, J. J., Martinez-Delgado, D., et al. 2005, ApJ, 626, L85 [Google Scholar]
- Wright, E. L., Eisenhardt, P. R. M., Mainzer, A. K., et al. 2010, AJ, 140, 1868 [Google Scholar]
- Zou, H., Zhou, X., Fan, X., et al. 2019, ApJS, 245, 4 [CrossRef] [Google Scholar]
- Zucker, D. B., Belokurov, V., Evans, N. W., et al. 2006, ApJ, 650, L41 [NASA ADS] [CrossRef] [Google Scholar]
All Tables
All Figures
|
Fig. 1. Left panel: position of the three dwarf galaxies (solid red circles) reported in this study with respect to the spiral NGC 253. The red circular line corresponds to the area explored by the PISCes survey (Toloba et al. 2016) extending up to ∼150 kpc from the centre of NGC 253. The total field of view of this image is 450′×480′. Right panel: full colour version of the image cutouts obtained with LEGACYPIPE for Do II, Do III, and Do IV. North is up and east is left. The field of view of all these image cutouts is 3.3′×3.3′. |
| In the text | |
|
Fig. 2. From left to right: dwarf galaxies in r-band, the GALFIT models, and the residual images after subtracting the model. The image scales and min max are the same for all the panels. The same procedure is done for modelling the g and z-band images. We mark the position of a few partially resolved sources in the galaxies that are visible in the residual images with red circles. |
| In the text | |
|
Fig. 3. Comparison of the degree of resolution of the stars of Do II in the DES images with the data from the same survey for two confirmed satellites of NGC 253 situated at similar distances (see Table 3): LVJ005−2310 and Scl–MM–Dw1. The field of view of these image cutouts are 4′ × 4′. North is up and east is left. |
| In the text | |
|
Fig. 4. Comparison of the photometric and structural parameters of the three dwarf galaxies reported in this study with those for the Milky Way and M 31 companions. |
| In the text | |
|
Fig. 5. Distribution of galaxies around NGC 253 in a 40° ×40° field in the supergalactic coordinates. The members of the NGC 253 group are shown by filled coloured circles. The background (reddish) and foreground (bluish) galaxies are marked with open circles. The redshift is colour-coded according to the key in the top left corner. Newly discovered objects are shown by magenta polygons. |
| In the text | |
|
Fig. 6. Map of galaxies in the vicinity of NGC 253 in the supergalactic coordinates. Left-hand panel: XY-projection on the supergalactic plane, while right-hand panel: edge-on view of the Local Supercluster ‘pancake’. The sizes and colours of the dots correspond to the absolute B-band magnitude and morphology of galaxies, following the keys at the top. The line segments indicate uncertainties in the distance estimations. Large circles around NGC 253 mark the virial zone, R200 ≈ 190 kpc, and the zero velocity surface, R0 ≈ 700 kpc. The magenta symbols indicate the expected position of the discovered galaxies. |
| In the text | |
|
Fig. 7. On-sky distribution of the galaxies listed in Table 3 in equatorial coordinates relative to the position of NGC 253 (black cross). The galaxies are colour-coded according to their line-of-sight velocity component relative to the NGC 253 velocity. Galaxies without velocity measurements are plotted in black. Galaxies (potentially) within 600 kpc of NGC 253 are marked with yellow boxes. The dashed black line indicates the on-sky orientation of the flattening of these objects. |
| In the text | |
|
Fig. 8. Best-fit parameters for the ToI fits to the spatial distributions of galaxies within 600 kpc of NGC 253. Shown from left to right are: the absolute rms plane height Δrms, the relative minor-to-major axis ratio c/a, the inclination i of the best-fit plane with the line of sight to NGC 253, and the perpendicular offset dNGC 253 of the best-fit plane from the host galaxy NGC 253 (which was not included in the plane fit). Each panel also gives the mean and standard deviations of the shown distributions. The realisations drawing from the observed galaxy distances (blue) are much more flattened (by both measures) than the randomised samples (grey) drawn from isotropic distributions around the position of NGC 253 but following the same radial distances. Satellite systems drawn from the Illustris TNG 100 simulation (red) are more flattened than isotropic distributions in both absolute plane height and axis ratio, but the observed system falls onto the more flattened tail of their distribution. |
| In the text | |
|
Fig. 9. Density distribution of the direction of plane-normal vectors (minor axis of 3D galaxy distribution) of the galaxies with measured distances within 600 kpc around NGC 253, for 1000 realisations drawn from the distance errors. Shown are supergalactic coordinates, indicating that the best-fit plane aligns closely with the Supergalactic plane. The red symbols indicate the eigenvectors of the tidal tensor at the position of NGC 253, which describe the principal directions of the surrounding cosmic web. The best-fit plane is well aligned with e1, the axis along which material in the cosmic web is compressed fastest. |
| In the text | |
Current usage metrics show cumulative count of Article Views (full-text article views including HTML views, PDF and ePub downloads, according to the available data) and Abstracts Views on Vision4Press platform.
Data correspond to usage on the plateform after 2015. The current usage metrics is available 48-96 hours after online publication and is updated daily on week days.
Initial download of the metrics may take a while.