Fig. 6.
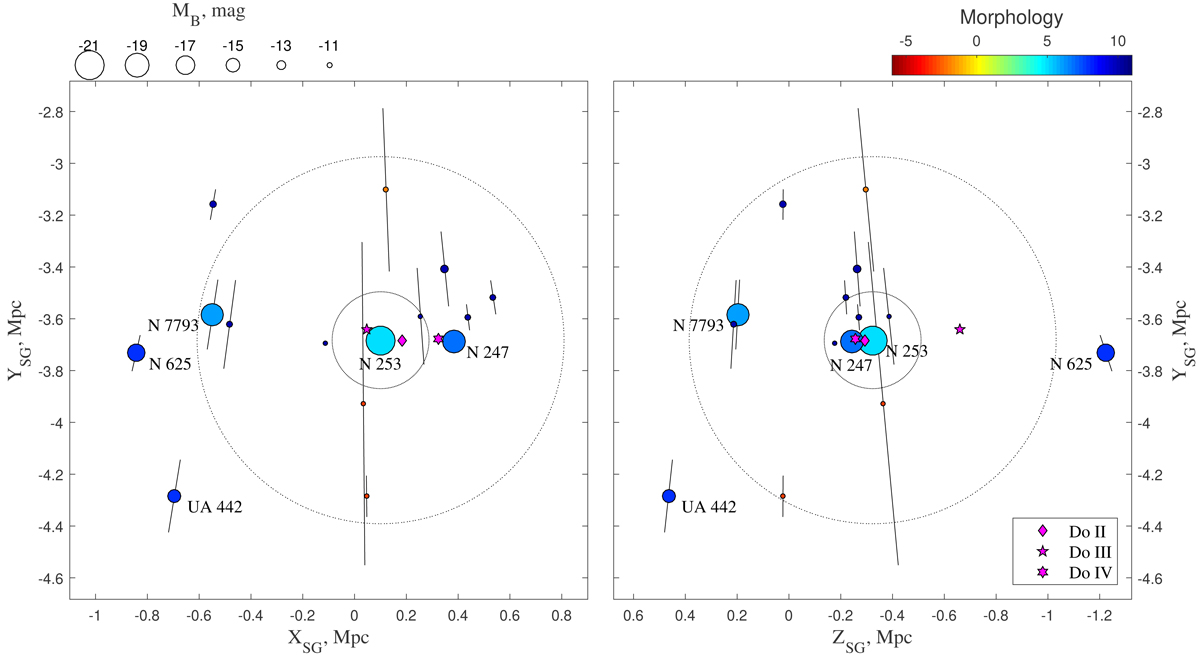
Map of galaxies in the vicinity of NGC 253 in the supergalactic coordinates. Left-hand panel: XY-projection on the supergalactic plane, while right-hand panel: edge-on view of the Local Supercluster ‘pancake’. The sizes and colours of the dots correspond to the absolute B-band magnitude and morphology of galaxies, following the keys at the top. The line segments indicate uncertainties in the distance estimations. Large circles around NGC 253 mark the virial zone, R200 ≈ 190 kpc, and the zero velocity surface, R0 ≈ 700 kpc. The magenta symbols indicate the expected position of the discovered galaxies.
Current usage metrics show cumulative count of Article Views (full-text article views including HTML views, PDF and ePub downloads, according to the available data) and Abstracts Views on Vision4Press platform.
Data correspond to usage on the plateform after 2015. The current usage metrics is available 48-96 hours after online publication and is updated daily on week days.
Initial download of the metrics may take a while.