Fig. 8.
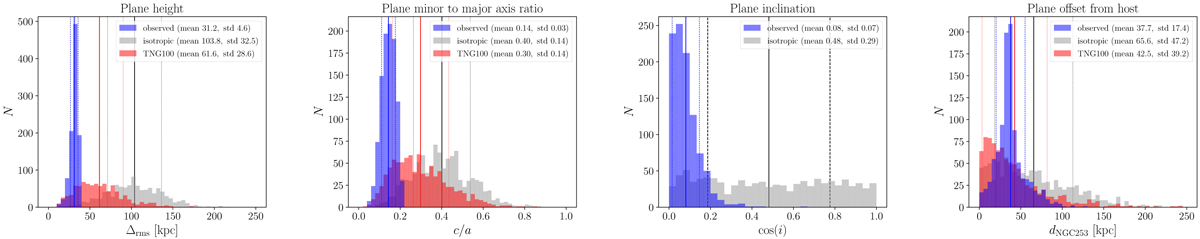
Best-fit parameters for the ToI fits to the spatial distributions of galaxies within 600 kpc of NGC 253. Shown from left to right are: the absolute rms plane height Δrms, the relative minor-to-major axis ratio c/a, the inclination i of the best-fit plane with the line of sight to NGC 253, and the perpendicular offset dNGC 253 of the best-fit plane from the host galaxy NGC 253 (which was not included in the plane fit). Each panel also gives the mean and standard deviations of the shown distributions. The realisations drawing from the observed galaxy distances (blue) are much more flattened (by both measures) than the randomised samples (grey) drawn from isotropic distributions around the position of NGC 253 but following the same radial distances. Satellite systems drawn from the Illustris TNG 100 simulation (red) are more flattened than isotropic distributions in both absolute plane height and axis ratio, but the observed system falls onto the more flattened tail of their distribution.
Current usage metrics show cumulative count of Article Views (full-text article views including HTML views, PDF and ePub downloads, according to the available data) and Abstracts Views on Vision4Press platform.
Data correspond to usage on the plateform after 2015. The current usage metrics is available 48-96 hours after online publication and is updated daily on week days.
Initial download of the metrics may take a while.