| Issue |
A&A
Volume 652, August 2021
|
|
|---|---|---|
| Article Number | A74 | |
| Number of page(s) | 7 | |
| Section | Atomic, molecular, and nuclear data | |
| DOI | https://doi.org/10.1051/0004-6361/202140858 | |
| Published online | 12 August 2021 | |
Carbon dioxide clathrate hydrate formation at low temperature
Diffusion-limited kinetics growth as monitored by FTIR
1
Institut des Sciences Moléculaires d’Orsay, UMR8214, CNRS, Université Paris-Saclay,
91405
Orsay,
France
e-mail: emmanuel.dartois@universite-paris-saclay.fr
1
Institut d’Astrophysique Spatiale, UMR8617, CNRS, Université Paris-Saclay,
91405
Orsay,
France
Received:
22
March
2021
Accepted:
31
May
2021
Context. The formation and presence of clathrate hydrates could influence the composition and stability of planetary ices and comets; they are at the heart of the development of numerous complex planetary models, all of which include the necessary condition imposed by their stability curves, some of which include the cage occupancy or host–guest content and the hydration number, but fewer take into account the kinetics aspects.
Aims. We measure the temperature-dependent-diffusion-controlled formation of the carbon dioxide clathrate hydrate in the 155–210 K range in order to establish the clathrate formation kinetics at low temperature.
Methods. We exposed thin water ice films of a few microns in thickness deposited in a dedicated infrared transmitting closed cell to gaseous carbon dioxide maintained at a pressure of a few times the pressure at which carbon dioxide clathrate hydrate is thermodynamically stable. The time dependence of the clathrate formation was monitored with the recording of specific infrared vibrational modes of CO2 with a Fourier Transform InfraRed spectrometer.
Results. These experiments clearly show a two-step clathrate formation, particularly at low temperature, within a relatively simple geometric configuration. We satisfactorily applied a model combining surface clathration followed by a bulk diffusion–relaxation growth process to the experiments and derived the temperature-dependent-diffusion coefficient for the bulk spreading of clathrate. The derived apparent activation energy corresponding to this temperature-dependent-diffusion coefficient in the considered temperature range is Ea = 24.7 ± 9.7 kJ mol−1. The kinetics parameters favour a possible carbon dioxide clathrate hydrate nucleation mainly in planets or satellites.
Key words: infrared: planetary systems / planets and satellites: composition / comets: general / methods: laboratory: solid state / solid state: volatile / molecular processes
© E. Dartois and F. Langlet 2021
 Open Access article, published by EDP Sciences, under the terms of the Creative Commons Attribution License (https://creativecommons.org/licenses/by/4.0), which permits unrestricted use, distribution, and reproduction in any medium, provided the original work is properly cited.
1 Introduction
Clathrate hydrates are inclusion compounds that trap molecules in a crystalline water ice network. For the two main structures, these clathrate hydrates form water-based cages of different sizes and of two types, a larger one (forming a hexagonal truncated trapezohedron or hexadecahedron) and a smaller one (forming a pentagonal dodecahedron), leading to the simplest clathrate structures I and II, respectively. On Earth, the main interest in clathrate hydrates is focused on methane clathrate hydrate, either as a potential hydrocarbon resource (e.g. Jin et al. 2020; Boswell et al. 2020) or for the problems caused by its ability to block pipelines in the petrol industry (e.g. Fink 2015) or its participation in climate change if natural fields are destabilised (Riboulot et al. 2018). Carbon dioxide clathrate hydrate is of interest for fundamental research on Earth, or for its potential use in greenhouse gas sequestration (Duc et al. 2007; House et al. 2006).
In a planetary or astrophysical context, clathrate hydrates are considered because they can retain volatile molecules at pressures higher than the pure compound that would otherwise sublimate under most astrophysical conditions, and/or influence the geophysics of large bodies (e.g. Fortes & Choukroun 2010; Choukroun et al. 2010; Bollengier et al. 2013). The existence of clathrate hydrates in Solar System bodies has been explored in many models, principally on the basis of the stability curves for these inclusion compounds. During the evolution of the solar nebula, the existence of clathrate hydrate, or rather its stability, depends on pressure and temperature. These thermodynamic properties represent a necessary but not sufficient condition. In many bodies, in particular small bodies such as comets, or low-temperature objects orbiting at large distances, such as trans-Neptunian objects, including Kuiper Belt objects, the kinetics for their formation becomes a primary driving factor to take into account in the modelling.
Carbon dioxide is a significant constituent of large to smaller icy bodies of the Solar System. The kinetics of carbon dioxide clathrate hydrate formation (Schmitt 1986; Schmitt et al. 2003; Circone et al. 2003; Genov et al. 2003) is a key ingredient in any discussion about clathrate formation. Kinetics experiments have been performed on clathrates using, for example, neutron diffraction experiments monitoring the ice structural change towards clathrate formation (Falenty et al. 2013; Henning et al. 2000), or more classical, Pressure, Volume, Temperature (PVT) experiments (Falenty et al. 2013) in the 272–185 K range. These experiments are mostly based on the polydisperse distribution of ice spheres, with peak size distributions generally in the 20–200 microns range. The interpretation of these data is performed using a modified so-called Johnson–Mehl–Avrami–Kolmogorov (JMAK) phenomenological model and knowledge of the size distribution of ice particles. The duration of the neutron diffraction experiments is often limited to typically tens of hours because of the availability of diffraction beam lines shifts, which can limit the temperature range explored. Indeed, as the diffusion coefficient generally follows an Arrhenius equation, it evolves exponentially with temperature and going to lower temperatures becomes a difficult issue, requiring long-duration experiments. In this article, we develop an alternative experimental approach based on the direct measurement, in transmittance, of the infrared signature of the caged molecules within a controlled thin ice film structure. This approach allows us to extend the measurements to lower temperatures (down to 155K) at which the kinetics are measured. The article is organised as follows: in the following section, we describe the kinetics experiments performed and the two-step diffusion and nucleation model adjusted to the data. We then discuss the results, derive the kinetics and apparent activation energy of the low-temperature carbon dioxide clathration, and discuss their astrophysical implications.
2 Experiments
CO2 was purchased from Air liquide. The initial purity is N25 (99.999%). The experimental setup consists in a gold-coated copper cell, thermally coupled to a liquid N2 -transfer cold finger placed in a high-vacuum, evacuated cryostat (P < 10−7 mbar). Infrared transmitting zinc selenide windows of 4 mm in thickness facing each other with some space in between, are sealed with indium gaskets, andallow the spectrometer beam to record clathrate hydrate spectra in transmittance. A soldered stainless steel injection tube brazed to the lower part of the cell allows the entry or evacuation of gas. A description of such a cell can be found in Dartois et al. (2010) for example. The cell was modified to limit the distance between the two ZnSe windows to a space of the order of 200 μm, which is sufficiently small to allow us to monitor the clathration of CO2 while the ice film is exposed to the gas. To prepare the ice film, water vapour is injected into the evacuated cell pre-cooled to 240K, and condenses on the ZnSe windows. The cell is then lowered to the temperature of study. The guest gas is then injected, with a pressure excess a few times the clathrate stability pressure, and below the CO2 ice condensation pressure. The pressures used are given in Table 1, as well as the expected equilibrium pressure for the clathrate stability. The thickness of the produced ice film varied from a fraction of a micron to several microns, and 13 mm in diameter. The thickness is monitored by Fourier Transform InfraRed (FTIR) spectroscopy, over the central 7 mm of the IR windows of the cell. Spectra were recorded regularly as a function of time, with a spectral resolution set between 0.16 and 0.32 cm−1, with a liquid nitrogen (LN2) Mercury Cadmium Telluride (MCT) detector. The time dependency sometimes presents some missing data, because the MCT detector, with an autonomy of about 10 h, could not always be kept cold over several months, and therefore no spectra were recorded during some time intervals.
Spectra from the experiment conducted at 165K are shown in Fig. 1. These were recorded at different times after the start of the experiment (1, 30, and 100 days). We also show the spectrum of the clathrate formed recorded immediately after the evacuation of the CO2 gas at the end of the experiment, after 2608 hours of exposure (more than 108 days). The clathrate spectrum is similar to the one expected from the 150K measurement reported in Dartois & Schmitt (2009), where the small and large clathrate cage environments were identified, and the structure I clathrate hydrate was confirmed. A close-up on the ν1 + ν3 and 2ν2 + ν3 (alternatively named ν1 + ν3 Fermi resonances 1 and 2) is shown. These combination modes were selected to follow the evolution of the process of clathration, because the gas phase absorptions are not fully saturated during pressurisation, and the caged CO2 infrared signature can be observed within the comb of the rovibrational transitions, as shown in Fig. 1. In addition to the cell temperature diode measurement, the gas phase CO2 temperature can also be monitored via the observed comb. We modelled the gas phase spectrum using the HITRAN database (Kochanov et al. 2016) for a 200 μm path length, a CO2 pressure of 60 mbar, and a gas temperature of 165K, and convolved using the transfer function of the spectrometer. The result is shown in the lower trace in Fig. 1, which also confirms the gas thermalisation.
Summary of experiments.
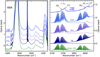 |
Fig. 1 Infrared spectra of the clathrate kinetics experiment performed at 165K. Spectra extracted after 1, 30, and 100 days of exposure of the ice film to CO2 gas at 60 mbar are shown in the 4500–600 cm−1 range in the left panel. The upper trace is the spectrum recorded just after evacuation of the gas at the end of the experiment after 118 days. A close-up on the gas and clathrate hydrate signatures in the ν1 + ν3 and 2ν2 + ν3 combinationmodes is shown in the right panel. Under each spectrum is shown the baseline-corrected spectrum of the contribution by the CO2 in the clathrate cages after subtraction of the gas phase contribution to the spectrum. The CO2 signatures inthe small (SC) and large (LC) cages of the clathrate hydrate are labelled in the upper trace. The lower trace is a model of the CO2 gas phase at165K. See text for details. |
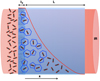 |
Fig. 2 Schematic representation of the integrated column density measurement in the experiment and dimensions used in Eqs. (1)–(5). The gas (on the left) is in contact with the ice film (in blue). The clathration proceeds through the boundary (δ0), and the bulk clathration and diffusion evolves with time over the length L. The red line illustrates a snapshot of the clathrate concentration progression in the ice film. The infrared beam (red cylinder) probes the column density of clathrates formed in the entire film at a given time. |
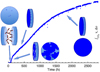 |
Fig. 3 Schematic representation of the incubation and nucleation, and diffusion-limited regimes. It is illustrated on the 165K CO2 clathrate time-dependent, integrated optical depth absorption curve evolution, as measured in the experiment. As time proceeds, we see the evolution of the degree of clathration (blue) of the ice film (light blue) when exposed to the CO2 gas in the pressurised cell. From left to right, the first inflexion shows the incubation time with an arrow, then JMAK surface clathration spreading and proceeding quickly from clathrate seeds, followed by diffusion-limited regimes of clathrate growth through the interface. |
3 Model
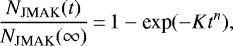
The low-temperature experiments show in particular that the clathration of the film is at least a two-step process (already mentioned in other experiments, e.g. Falenty et al. 2013), which is particularly well observed in the 165 and 175 K experiments where the two steps are well decoupled in the clathration time-sequence. The surface in direct contact with the gas initiates the first phase. The initial phase is kinetically driven and the clathrate surface coverage can be described as points randomly distributed on the ice surface that then grow up to a limited depth δ0, after which the growth proceeds through a diffusion- or relaxation-limited evolution. The quasi-two-dimensional evolution of the ice interface can therefore be described by a Johnson-Mehl–Avrami–Kolmogorov (JMAK) model: a model describing the coverage time dependence and kinetics (Fanfoni & Tomellini 1998), represented by a simple equation:
 (1)
(1)
which characterises the fraction of clathration after a hold time at a given temperature. Here, K and n are constants; n typically varies between 2 and 4 for 2D to 3D transformations; and NJMAK(∞) is the column density of clathrate cells, monitored through the CO2 combination modes, corresponding to the characteristic (surface) thickness δ0. The second phase occurring after the surface clathration (or concomitantly, at high temperatures) is the diffusion-limited clathrate growth in the bulk of the ice film of thickness L (Fig. 2). The low-temperature evolution of the infrared spectra guides the analysis to be performed, as it is the moment when the different phases are best observed separately. At late times in the 165 K evolution of the CO2 clathrate infrared signature, integrated over the film thickness, the clathrate growth behaviour is purely diffusion-limited. At intermediate times, it transits from the surface clathration behaviour to a diffusive behaviour (see Fig. 3). The evolution of the clathrate column density resembles many other so-called two-step diffusion problems, in which the concentration at the surface boundary does not rise immediately to its value at infinite time, either because of the irregular nature of the surface skin already clathrated or because of a kinetic barrier to the solely diffusion-driven clathrate transformation. This kinetic barrier can be influenced by the local CO2 concentration (the transformation can be hindered or much slower at low CO2 diffusive concentrations), or the relaxation needed to accommodate the volume change during clathrate transformation (an empty structure I hydrate would have a density of 0.796 g cm−3 (Uchida et al. 1997), whereas ice Ic and Ih have densities in the range of 0.916–0.93 g cm−3 (Petrenko & Withworth 1999)). This diffusion behaviour can be modelled using a progressive clathration through the boundary, and the concentration at the boundary becomes time dependent. These variable concentration model conditions can be described by
![\begin{equation*}\textrm{Clh}(t)\,{=}\,\textrm{Clh}(t_0) + [\textrm{Clh}(\infty) - \textrm{Clh} (t_0)] [1-\textrm{exp}(-\beta t)].\end{equation*}](/articles/aa/full_html/2021/08/aa40858-21/aa40858-21-eq2.png) (2)
(2)
At the surface interface, the clathrate hydrate formation proceeds as the concentration rises to a given initial value immediately after the surface clathration (Clh (t0)) and evolves to the final value at equilibrium (infinite time, Clh(∞)), through a first-order relaxation process. The clathrate concentration thus increases with the difference with respect to the equilibrium value Clh(∞), and reaches this equilibrium value asymptotically at infinite time. Such a model has been mathematically derived for a membrane of thickness 2 × L, with the two boundaries exposed to the concentration evolution prescribed by Eq. (2) (e.g. Long & Richman 1960; Crank 1975; Mamaliga & Negoescu 2012). Mathematically, the situation of one surface exposed to this concentration evolution and limited by an impermeable boundary atL (the ZnSe substrate surface on which the ice film is deposited in our experiments; cf. Fig. 2) is equivalent to two surfaces of amembrane exposed with no boundary. The time-dependent solution to this diffusion-limited growth can therefore be described by
![\begin{multline*}\textrm{Clh} (\lambda,\theta)\,{=}\,\!\phi \left[1 \! - \! \frac{4}{\pi} \displaystyle\sum_{n\,{=}\,0}^{\infty}\frac{(-1)^n}{2n+1} \textrm{cos} \frac{(2n+1)\pi \lambda}{2}\textrm{exp}\left(\frac{-(2n+1)^2 \pi^2 \theta}{4} \right)\right]\\+ (1-\phi) \left[1 - \frac{\textrm{cos}(\sqrt{\psi} \lambda) \textrm{exp}(-\psi\theta)}{\textrm{cos}(\sqrt{\psi})}- \frac{4}{\pi} \displaystyle\sum_{n\,{=}\,0}^{\infty}\frac{(-1)^n}{(2n+1) \left(1-\frac{(2n+1)^2\pi^2}{4\psi} \right)} \right.\\\left. \textrm{cos} \frac{(2n+1)\pi \lambda}{2}\textrm{exp}\left(\frac{-(2n+1)^2 \pi^2 \theta}{4} \right)\right],\end{multline*}](/articles/aa/full_html/2021/08/aa40858-21/aa40858-21-eq3.png)
where λ = x∕L, ϕ = Clh(t0)∕Clh(∞), θ = Dt∕L2, ψ = βL2∕D, x is the distance from the boundary of the surface clathrate, L is the film thickness starting from the depth δ0 of the surface clathrate formation (the total film thickness is thus L + δ0, see Fig. 2), D (m2 s-1) is the diffusion coefficient, and ϕ is the ratio of immediate to long time equilibrium concentrations at the surface clathrate boundary. We note that ϕ = 1 is the sign of a CO2 immediate diffusion-driven clathration process, in which case the second term of Eq. (3) vanishes. The column density evolution of the clathration integrated over the film, i.e. what is measured by infrared spectroscopy, then follows
![\begin{multline*}\frac{N_{\textrm{D}}(t)}{N_{\textrm{D}}(\infty)}\,{=}\, \phi \left[1 - \frac{8}{\pi} \displaystyle\sum_{n\,{=}\,0}^{\infty} \frac{\textrm{exp}\left(\frac{-(2n+1)^2 \pi^2 \theta}{4} \right)}{(2n+1)^2} \right] \\+ (1-\phi) \left[1 - \frac{\tan\sqrt{\psi}\textrm{exp}(-\psi\theta)}{\sqrt{\psi}} \frac{8}{\pi}\displaystyle\sum_{n\,{=}\,0}^{\infty}\frac{\textrm{exp}\left(\frac{-(2n+1)^2 \pi^2 \theta}{4} \right)}{(2n+1)^2\left(1 - \frac{(2n+1)^2 \pi^2}{4\psi}\right)} \right].\hspace*{-12pt}\\[-10pt]\end{multline*}](/articles/aa/full_html/2021/08/aa40858-21/aa40858-21-eq4.png)
The overall measured column density of the carbon dioxide clathrate formation is the sum of the surface and bulk diffusion-limited growths,
 (5)
(5)
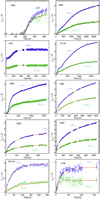 |
Fig. 4 Time-dependent evolution of the integrated optical depth of CO2 clathrate infrared signatures in the various experiments performed. The ν1 + ν3 mode (~ 3700 cm−1) is represented in blue. The 2ν2 + ν3 mode (~ 3590 cm−1) is represented in green. |
4 Results and astrophysical implications
The time-dependent evolution of the integrated absorption of the ν1 + ν3 and 2ν2 + ν3 modes at temperatures from 165 K to 210 K, and with starting ice film thicknesses of several microns, is shown in Fig. 4. In the 155K experiment, the gas pressure is low enough to use the stretching ν3 and bending ν2 modes, but the constraint is only an upper limit because our experiment is limited to about 18 days. The experimentsare fitted with the model given by Eq. (5). To find the best fits, the error function 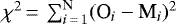 , where Oi are the observed experimental point and Mi are the calculated model points, is minimised. The results of the minimisation are over-plotted on the data shown in Fig. 4 for the experiments performed, and the corresponding retrieved parameters are reported in Table 1. In many practical cases, the diffusion-limited error bars on fitted diffusion models are overlooked, because the observed evolution of the process is smooth, and the numerous parameters in the models describing diffusion problems make it possible to have several neighbouring and almost equally good fits to the experimental data. In order to retrieve the best-fit parameters and also estimate uncertainties (i.e. more systematic error bars) associated with the model, we use an amoeba algorithm, implementing a downhill simplex method (Nelder & Mead 2016). The algorithm performs a multidimensional minimisation of the above error function. The initial parameters of the amoeba function are varied to explore the parameter space. The first moment of the solutions obtained for each parameter with different starting points are calculated. Error bars are given by the standard deviation for the solutions within three times the minimum value of the error function (i.e. a reduced χ2). The JMAK Eq. (1) parameters are retrieved with the best significance from the low-temperature experiments, where the kinetics do not overly mix the surface and volume diffusion-integrated effects. In our experiments, the clathrate formation process is controlled by the diffusion rate of CO2 molecules through the surface clathrate hydrate layer. The advantages of our technique over many previous experiments include the much simpler dimensionality of the system formed in our experiments, the possibility to vary the ice thickness, and the direct monitoring of the caged molecule signatures. At low temperature, the surface nucleation (nucleation proceeding laterally from clathrate hydrate surface seeds) is expected to be more efficient than the mass transfer (permeation) through the surface followed by clathrate formation. The ice surface clathrate nucleation is limited to a depth of the order of a micron or to submicron depths in our explored range of temperatures, and therefore will only penetrate and nucleate deeper by diffusion.
The diffusion coefficient obtained from the fits are reported on a logarithmic scale as a function of the inverse of the temperature in Fig. 5, with the error bars discussed above. We performed a fit to derive the apparent activation energy Ea corresponding to the temperature dependence of the diffusion, which approximately follows an Arrhenius law (D(T) ∝exp(−Ea∕kT)). The temperature dependence of the diffusion-controlled clathration process we measure in the 210–155 K range possesses an activation energy of Ea = 24.7 ± 9.7 kJ mol−1. This diffusion activation energy is lower than the one measured at temperatures above about 220 K by Falenty et al. (2013) of Ea ≈ 46 kJ mol−1, whereas Henning et al. (2000) measured an activation energy of Ea = 27.2 kJ mol−1 measured in the 230–263 K range, both derived from neutron experiments on clathrates with a D2 O lattice. Our determined value is in agreement with the <225 K Falenty et al. (2013) activation energy of Ea = 19 kJ mol−1 based on experiments with an H2O lattice; the error bar for these latter results was not specified but should largely overlap with our determination. If we include the Falenty et al. (2013) data below 225 K, we find Ea = 22.6 ± 5.4 kJ mol−1. Other studies of other clathrate hydrates led to somewhat comparable values of activation energy: C2 H6 clathrates formed from ice + liquid C2 H6 ~15 kJ mol−1 (Vu et al. 2020); Tetrahydrofuran clathrates formed under vacuum conditions ~23 kJ mol−1 (Ghosh et al. 2019). Most of these experimental results, with similar values for the apparent activation energy, suggest the view of a diffusion-limited process driven by the movement or reorganisation of water ice. In their molecular dynamics models, Liang et al. (2016) found a high activation energy of Ea = 44 ± 6 kJ mol−1. In a water-solvent-driven diffusion of CO2 in low density amorphous (LDA) ice, Ghesquière et al. (2015) calculate an activation energy of 25 ± 2.4 kJ mol−1, in relatively good agreement with what we deduce at low temperature.
The nucleation of the seeds and the self-diffusion of water on the surface of ice grains could play an important role in the rearrangement of ice Ih into the first clathrate cage structure, with an activation energy on the order of 23 kJ mol−1 (Nasello et al. 2007; Oxley et al. 2006). Bulk (self-)diffusion of water into Ih single crystal ice multilayers of various thicknesses (Brown & Georges 1996), and with other molecules (Livingston et al. 2002), proceeds with a much higher activation energy (Ea≈ 50–70 kJ mol−1). As stated inthese latter articles, and especially for bulk ice, the ice morphology (amorphous, polycrystalline, or crystalline) will influence the efficiency of the diffusion into the ice, and the apparent activation energy.
Carbon dioxide is present in the ice mantles in interstellar molecular clouds with an abundance of several tens of percent (e.g. Boogert et al. 2015; de Graauw et al. 1996; Pontoppidan et al. 2008; Dartois 2005). This is probably not the place to look for clathrates formed by bulk diffusion of CO2 into ice first. Indeed, consider a simplistic back-of-the-envelope calculation based on our findings, taking the lifetime of a dense cloud containing ices of the order of a few tens of millions of years (e.g. t0 ≈ 5 × 10⁷ yr) as the maximum diffusion time. To nucleate a r = 0.1 μm ice grain clathrate by bulk diffusion during this lifetime requires D ≈ r2∕t0 = 6 × 10⁻³⁰ m2 s−1. Extrapolating the diffusion coefficient from Fig. 5 to lower temperatures would require maintaining the icy grain exposed to CO2 at temperatures higher than about 65 K, which is well above typical ice mantle temperatures. A clathrate could alternatively form by restructuring a previously condensed simple hydrate CO2:H2O mixture during a hotter phase. However, the driving force forming a crystalline compound phase such as a clathrate hydrate at such low temperatures before water ice sublimation raises many questions. The transformation kinetics associated with such low temperatures experienced by ice mantle grains still needs to be better understood.
Clathrate hydrates may be more relevant to protoplanetary disks. In models of the early protosolar solar nebula (PSN), the protosolar disk pressure and temperature (P, T) follow a so-called cooling curve. This curve can be associated to a thermodynamic path for the existence of clathrate hydrates (e.g. Mousis et al. 2010). However, if satisfying the thermodynamics equilibrium curves is a necessary condition for the existence of a clathrate hydrate phase, it is a far too simplistic assumption to prescribe that clathrate hydrates are formed as soon as the P, T stability conditions are met. The composition range, kinetics, and competing phase formation are also essential parameters determining the existence of clathrate hydrates. If during the PSN evolution, water ice condenses first onto small- to intermediate-sized bodies (i.e. not the ones forming planets and/or large satellites where pressure will make the difference), because of a progressive decrease of the temperature of the PSN, this will limit the scope of direct clathrate nucleation in such objects. Unless exposed to moderate pressures for a long time, kinetics and thermodynamics favour CO2 and H2 O separate sequential ice phase condensation, or eventually low-temperature hydrate (non-clathrate) mixing.
CO2 has been directly observed in the gas phase in many comets or inferred from the CO Cameron excited band resulting from the photodestruction of CO2 molecules (e.g. Fougere et al. 2016; Bockelée-Morvan et al. 2016; Steckloff et al. 2016; Migliorini et al. 2016; McKay et al. 2016, 2015; Ootsubo et al. 2012; A’Hearn et al. 2012; Feaga et al. 2007; Colangeli et al. 1999; Crovisier et al. 1997; Feldman et al. 1997; Weaver et al. 1994; Combes et al. 1988), raising the possibility of the presence of CO2 clathrate hydrate. Clathrate hydrates can, in particular, be a posterior to formation phenomenon occurring in comets, particularly when mobility and internal pressures build up during the comet entry into the inner Solar System, possibly forming a subsurface clathrate layer, including the CO2 layer in comets (e.g. Marboeuf et al. 2011), which will consequently act as a permeation barrier or disrupt the degassing. Cometary models include the clathrate phase, among others (crystalline, amorphous, pure condensed phases, trapped hydrates), to explore their influence (e.g. Marboeuf & Schmitt 2014; Brugger et al. 2016). Observationally, if clathrate hydrates are shown to be present in comets (i.e. detected by direct techniques such as the observation of spectroscopic signatures), then they will have to be taken into account when modelling the degassing pattern of species in comets through the physical properties of this specific phase, such as the kinetics, permeation filter, and/or their destabilisation. Direct observational proof of clathrate hydrates remains elusive in these Solar System objects.
The case of planets, satellites, or any astrophysical body where significant pressures can build up are the objects that are most prone to hosting clathrate hydrates. The Jovian Europa, Ganymede, and Callisto, Saturn’s Iapetus, Phoebe, and Hyperion, the Uranian Ariel, Umbriel, and Titania, and Neptune’s Triton (e.g. Brown et al. 2006; Buratti et al. 2005; Clark et al. 2005; Hibbitts et al. 2000, 2003; Quirico et al. 1999) have all been shown to harbour CO2. The stability of clathrates at depth in several objects has been mentioned in numerous studies (e.g. Kamata et al. 2019; Choukroun et al. 2013; Castillo-Rogez et al. 2012; Tobie et al. 2012; Sohl et al. 2010; Hand et al. 2006; Prieto-Ballesteros et al. 2005; Loveday et al. 2001; Stevenson & Lunine 1986; Miller 1985). These studies mention that from a thermodynamical point of view, clathrate hydrates are stable at depth, potentially mobilising from ‘thin’ ice layers of a few kilometres in size up to hundreds of kms, and that clathrate hydrates are likely stable close to the surface, for example in the crust and the possible ocean of Europa, potentially in ice caps (seasonally) on Mars, or from the very surface for cold objects such as Titan. Clathrate hydrates are likely to be present in the subsurface, affecting its mechanical and fluid behaviour, and would be stable, if present, at the surface of many very cold natural satellites, or objects orbiting in the outer regions of the Solar System. However, up to now, observed spectroscopic signatures do not show evidence for the formation of CO2 clathrate at the surface.
Specifically, Mars has prompted some discussion about CO2 clathrate hydrates. Part of the Martian surface might experience temperature and pressures that pass through the CO2 clathrate stability equilibrium (e.g. Longhi 2006). CO2 is abundantin the atmosphere of Mars and in the solid phase there, with some CO2 ice deposits layered withH2O in the south pole (Buhler et al. 2019; Titus et al. 2003) and some pure water ice phase in the north pole (Grima et al. 2009) or just below the surface even at moderate to high latitudes (Piqueux et al. 2019). For a stable clathrate field, clathrate must be able to (re-)form and/or resist with kinetics compatible with the latitude-dependent Martian daily, annual and up to secular pressure and temperature variations (e.g. Smith et al. 2016; Byrne 2009; Nye et al. 2000). For a diffusion coefficient of 10−18–10−20 m2 s−1, which, according to our measurements, corresponds to the 170–135 K range, that is, temperatures typical of high latitudes, the clathration of 10 μm of ice takes approximately 30–320 yr, respectively. It is noteworthy that the CO2 sublimation curve boundary crosses the CO2 clathrate hydrate stability curve. This implies that below the corresponding crossing-point temperature shown in Fig. 5 with an orange symbol (in the 130.2–132.5 K range as stated in Dartois & Schmitt (2009), including uncertainties in the different clathrate equilibrium experiments), the CO2 clathrate is stable, but the kinetics of formation by diffusion of CO2 in water icewill most probably be considerably hindered by the formation of pure solid CO2 crusts or layers. Therefore, diffusion into the ice at the interface below this point will no longer proceed via the contact with gaseous CO2. It is expected that a change of behaviour in the diffusion problem will occur. The presence of CO2 clathrates isalso discussed in the context of the ancient Mars, and is thought to have possibly influenced the past history of the Martian climate evolution, at earlier times, where surface and subsurface conditions may have been more favourable to clathrate hydrate formation (e.g. Chassefière et al. 2013).
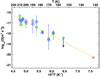 |
Fig. 5 Diffusion coefficient retrieved from the analyses of the time-dependent FTIR spectra of the 2ν2 + ν3 (blue circle) and ν1 + ν3 (green square) CO2 caged in the clathrate hydrate (for the 155 K point the ν2 and ν3 modes wereused instead; see text). The data are fitted with an Arrhenius law shown by the dashed orange line. The red star indicates the expected temperature of the crossing point between the sublimation curve of pure CO2 and the stability curve of the CO2 clathrate hydrate below which the pure CO2 solid phase dominates the stability. |
5 Conclusion
We measured the temperature-dependent diffusion-controlled formation of a carbon dioxide clathrate hydrate in the 155–210 K range by direct monitoring of the caged CO2 specific clathrate hydrate infrared signatures. The diffusion coefficient associated with the clathrate diffusion-controlled nucleation kinetics was deduced. It proceeds with an activation energy of Ea = 24.7 ± 9.7 kJ mol−1, which is lower than the one found at higher ice temperatures. Combining these measurements with previous kinetics measurements, the data are now available to implement the kinetics of CO2 hydrate formation from ice in models, for temperatures ranging from the clathrate–solid CO2 crossing point around 130 K, by slight extrapolation, up to the water triple point. Looking at the low-temperature-dependent diffusion coefficient associated with clathrate formation, carbon dioxide clathrate hydrate nucleation is principally expected in planets or satellites, and may build up with moderate pressures and higher temperatures from simple hydrates in comets as they enter the inner Solar System.
Acknowledgements
Part of the equipment used in this work has been financed by the French INSU-CNRS program ‘Physique et Chimie du Milieu Interstellaire’ (PCMI). We wish to acknowledge past years technical support on the experiment cell conception from A. Arondel, M. Bouzit, M. Chaigneau, N. Coron, B. Crane, T. Redon.
References
- A’Hearn, M. F., Feaga, L. M., Keller, H. U., et al. 2012, ApJ, 758, 29 [NASA ADS] [CrossRef] [Google Scholar]
- Bockelée-Morvan, D., Crovisier, J., Erard, S., et al. 2016, MNRAS, 462, S170 [Google Scholar]
- Bollengier, O., Choukroun, M., Grasset, O., et al. 2013, Geochim. Cosmochim. Acta, 119, 322 [NASA ADS] [CrossRef] [Google Scholar]
- Boogert, A. C. A., Gerakines, P. A., & Whittet, D. C. B. 2015, ARA&A, 53, 541 [Google Scholar]
- Boswell, R., Hancock, S., Yamamoto, K., et al. 2020, in Future Energy (Third Edition), ed. T. M. Letcher (Elsevier), 111, [CrossRef] [Google Scholar]
- Brown, D. E., & Georges, S. M. 1996, J. Phys. Chem. 100, 15460 [CrossRef] [Google Scholar]
- Brown, R. H., Baines, K. H., Bellucci, G., et al. 2006, A&A, 446, 707 [NASA ADS] [CrossRef] [EDP Sciences] [Google Scholar]
- Brugger, B., Mousis, O., Morse, A., et al. 2016, ApJ, 822, 98 [CrossRef] [Google Scholar]
- Buhler, P. B., Ingersoll, A. P., Piqueux, S., et al. 2019, Nat. Astron., 4, 364 [CrossRef] [Google Scholar]
- Buratti, B. J., Cruikshank, D. P., Brown, R. H., et al. 2005. ApJ, 622, L149 [NASA ADS] [CrossRef] [Google Scholar]
- Byrne, S. 2009, Annu. Rev. Earth Planet. Sci., 37, 535 [CrossRef] [Google Scholar]
- Castillo-Rogez, J. C., Johnson, T. V., Thomas, P. C., et al. 2012, Icarus, 219, 86 [NASA ADS] [CrossRef] [Google Scholar]
- Chassefière, E., Dartois, E., Herri, J.-M., et al. 2013, Icarus, 223, 878 [NASA ADS] [CrossRef] [Google Scholar]
- Choukroun, M., Grasset, O., Tobie, G., et al. 2010, Icarus, 205, 581 [NASA ADS] [CrossRef] [Google Scholar]
- Choukroun, M., Kieffer, S. W., Lu, X., et al. 2013, Astrophys. Space Sci. Libr., 409 [NASA ADS] [CrossRef] [Google Scholar]
- Circone, S., Stern, L. A., Kirby, S. H., et al. 2003, J. Phys. Chem. B 107, 5529 [CrossRef] [Google Scholar]
- Clark, R. N., Brown, R. H., Jaumann, R., et al. 2005, Nature, 435, 66 [NASA ADS] [CrossRef] [PubMed] [Google Scholar]
- Colangeli, L., Epifani, E., Brucato, J. R., et al. 1999, A&A, 343, L87 [NASA ADS] [Google Scholar]
- Combes, M., Crovisier, J., Encrenaz, T., Moroz, V. I., & Bibring, J.-P. 1988, Icarus, 76, 404 [NASA ADS] [CrossRef] [PubMed] [Google Scholar]
- Crank,J. 1975, The Mathematics of Diffusion (Oxford: Clarendon Press), 333 [Google Scholar]
- Crovisier, J., Leech, K., Bockelee-Morvan, D., et al. 1997, Science, 275, 1904 [CrossRef] [Google Scholar]
- Dartois, E. 2005, Space Sci. Rev., 119, 293 [NASA ADS] [CrossRef] [Google Scholar]
- Dartois, E., & Schmitt, B. 2009, A&A, 504, 869 [NASA ADS] [CrossRef] [EDP Sciences] [Google Scholar]
- Dartois, E., Deboffle, D., & Bouzit, M. 2010, A&A, 514, A49 [CrossRef] [EDP Sciences] [Google Scholar]
- Duc, N. H., Chauvy, F., & Herri J.-M. 2007, Energy Conversion Manag. 481313 [Google Scholar]
- de Graauw, T., Whittet, D. C. B., Gerakines, P. A., et al. 1996, A&A, 315, L345 [Google Scholar]
- Falabella, B. J. 1975, PhD Thesis, University of Massachussetts, Ann Arbor, MA, USA [Google Scholar]
- Falenty, A., Salamatin, A. N., & Kuhs, W. F. 2013, J. Phys. Chem. C, 117, 8443 [CrossRef] [Google Scholar]
- Fanfoni, M., & Tomellini, M. 1998, Nuovo Cimento D Serie, 020, 1171 [CrossRef] [Google Scholar]
- Feaga, L. M., A’Hearn, M. F., Sunshine, J. M., Groussin, O., & Farnham, T. L. 2007, Icarus, 190, 345 [NASA ADS] [CrossRef] [Google Scholar]
- Feldman, P. D., Festou, M. C., Tozzi, G. P., & Weaver, H. A. 1997, ApJ, 475, 829 [NASA ADS] [CrossRef] [Google Scholar]
- Fink, J. 2015 Petroleum Engineer’s Guide to Oil Field Chemicals and Fluids (Houston, TX, USA: Gulf Professional Publishing), [Google Scholar]
- Fortes, A. D., & Choukroun, M. 2010, Space Sci. Rev., 153, 185 [NASA ADS] [CrossRef] [Google Scholar]
- Fougere, N., Altwegg, K., Berthelier, J.-J., et al. 2016, A&A, 588, A134 [NASA ADS] [CrossRef] [EDP Sciences] [Google Scholar]
- Genov, G., & Kuhs, W. F. 2003, Third International Conference on Mars Polar Science and Exploration, 8011 [Google Scholar]
- Ghesquière, P., Mineva, T., Talbi, D., et al. 2015, Phys. Chem. Chem. Phys. (Incorporating Faraday Trans.), 17, 11455 [CrossRef] [Google Scholar]
- Ghosh, J., Bhuin, R. G., Ragupathy, G., & Pradeep, T. 2019, J. Phys. Chem. C, 123, 16300 [CrossRef] [Google Scholar]
- Grima, C., Kofman, W., Mouginot, J., et al. 2009, Geophys. Res. Lett., 36, L03203 [CrossRef] [Google Scholar]
- Hand, K. P., Chyba, C. F., Carlson, R. W., et al. 2006, Astrobiology, 6, 463 [NASA ADS] [CrossRef] [PubMed] [Google Scholar]
- Henning, R. W., Schultz, A. J., Thieu, V., & Halpern, Y. 2000, J. Phys. Chem. A, 104, 5066 [CrossRef] [Google Scholar]
- Hibbitts, C. A., McCord, T. B., & Hansen, G. B., 2000. J. Geophys. Res. 105, 2254 [NASA ADS] [CrossRef] [Google Scholar]
- Hibbitts, C. A., Pappalardo, R. T., Hansen, G. B., & McCord, T. B. 2003, J. Geophys. Res. (Planets), 108, 5036 [NASA ADS] [CrossRef] [Google Scholar]
- House, K. Z., Schrag, D. P., Harvey, C. F., et al. 2006, Proc. Natl. Acad. Sci. U.S.A., 103, 12291 [CrossRef] [Google Scholar]
- Jin, Y., Kida, M., Yoneda, J., et al. 2020, ACS Earth Space Chem., 4, 77 [CrossRef] [Google Scholar]
- Kamata, S., Nimmo, F., Sekine, Y., et al. 2019, Nat. Geosci., 12, 407 [Google Scholar]
- Kochanov, R. V., Gordon, I. E., Rothman, L. S., et al. 2016, J. Quant. Spec. Radiat. Transf., 177, 15 [CrossRef] [Google Scholar]
- Liang, S., Liang, D., Wu, N., Yi, L., & Hu, G. 2016, J. Phys. Chem. C 120, 16298 [CrossRef] [Google Scholar]
- Livingston, F. E., Smith, J. A., & George, S. M. (2002). J. Phys. Chem. A, 106, 6309 [CrossRef] [Google Scholar]
- Long, F. A., & Richman, D. 1960, J. Am. Chem. Soc., 82, 513 [CrossRef] [Google Scholar]
- Longhi, J. 2006, J. Geophys. Res. (Planets), 111, E06011 [NASA ADS] [CrossRef] [Google Scholar]
- Loveday, J. S., Nelmes, R. J., Guthrie, M., et al. 2001, Nature, 410, 661 [CrossRef] [PubMed] [Google Scholar]
- Mamaliga, I., & Negoescu, C. 2012, Environ. Eng. Manage. J., 11, 2091 [CrossRef] [Google Scholar]
- Marboeuf, U., & Schmitt, B. 2014, Icarus, 242, 225 [NASA ADS] [CrossRef] [Google Scholar]
- Marboeuf, U., Mousis, O., Petit, J.-M., et al. 2011, A&A, 525, A144 [NASA ADS] [CrossRef] [EDP Sciences] [Google Scholar]
- McKay, A. J., Cochran, A. L., DiSanti, M. A., et al. 2015, Icarus, 250, 504 [NASA ADS] [CrossRef] [Google Scholar]
- McKay, A. J., Kelley, M. S. P., Cochran, A. L., et al. 2016, Icarus, 266, 249 [CrossRef] [Google Scholar]
- Migliorini, A., Piccioni, G., Capaccioni, F., et al. 2016, A&A, 589, A45 [NASA ADS] [CrossRef] [EDP Sciences] [Google Scholar]
- Miller, S. L. 1985, Ices Solar Syst., 156, 59 [CrossRef] [Google Scholar]
- Miller, S. L., & Smythe, W. D. 1970, Science, 170, 531 [NASA ADS] [CrossRef] [Google Scholar]
- Mousis, O., Lunine, J. I., Picaud, S., et al. 2010, Faraday Discuss., 147, 509 [NASA ADS] [CrossRef] [Google Scholar]
- Nasello, O. B., de Juarez, S. N., & Di Prinzio, C. L. 2007, Scripta Materialia, 56, 1071 [CrossRef] [Google Scholar]
- Nelder, J. A., & Mead, R. 1965 Comput. J., 7, 308 [CrossRef] [Google Scholar]
- Nye, J. F., Durham, W. B., Schenk, P. M., et al. 2000, Icarus, 144, 449 [NASA ADS] [CrossRef] [Google Scholar]
- Ootsubo, T., Kawakita, H., Hamada, S., et al. 2012, ApJ, 752, 15 [NASA ADS] [CrossRef] [Google Scholar]
- Oxley, S. P., Zahn, C. M., & Pursell, C. J. 2006, J. Phys. Chem. A, 110, 11064 [CrossRef] [Google Scholar]
- Petrenko, V. F., & Whitworth, R. W., 1999, Physics of Ice (Oxford, UK: Oxford Univiversity Press) [Google Scholar]
- Piqueux, S., Buz, J., Edwards, C. S., et al. 2019, Geophys. Res. Lett., 46, 290 [CrossRef] [Google Scholar]
- Pontoppidan, K. M., Boogert, A. C. A., Fraser, H. J., et al. 2008, ApJ, 678, 1005 [NASA ADS] [CrossRef] [Google Scholar]
- Prieto-Ballesteros, O., Kargel, J. S., & Fernández-Sampedro, M., et al. 2005, Icarus, 177, 491 [NASA ADS] [CrossRef] [Google Scholar]
- Quirico, E., Douté, S., Schmitt, B., et al. 1999, Icarus 139, 159 [NASA ADS] [CrossRef] [Google Scholar]
- Riboulot, V., Ker, S., Sultan, N., et al. 2018, Nat. Commun., 9, 117 [CrossRef] [Google Scholar]
- Schmitt, B., 1986 Thesis, UJF-France, 201 [Google Scholar]
- Schmitt, B., Mulato, L., & Douté, S. 2003, Third International Conference on Mars Polar Science and Exploration, 8073 [Google Scholar]
- Smith, I. B., Putzig, N. E., Holt, J. W., et al. 2016, Science, 352, 1075 [CrossRef] [Google Scholar]
- Sohl, F., Choukroun, M., Kargel, J., et al. 2010, Space Sci. Rev., 153, 485 [CrossRef] [Google Scholar]
- Steckloff, J. K., Graves, K., Hirabayashi, M., et al. 2016, Icarus, 272, 60 [CrossRef] [Google Scholar]
- Stevenson, D. J., & Lunine, J. I. 1986, Nature, 323, 46 [CrossRef] [Google Scholar]
- Titus, T. N., Kieffer, H. H., & Christensen, P. R. 2003, Science, 299, 1048 [CrossRef] [Google Scholar]
- Tobie, G., Gautier, D., & Hersant, F. 2012, ApJ, 752, 125 [CrossRef] [Google Scholar]
- Uchida, T. 1997, Waste Manage., 17, 343 [CrossRef] [Google Scholar]
- Vu, T. Â. H., Choukroun, M., Sotin, C., et al. 2020, Geophys. Res. Lett., 47, e86265 [CrossRef] [Google Scholar]
- Weaver, H. A., Feldman, P. D., McPhate, J. B., et al. 1994, ApJ, 422, 374 [NASA ADS] [CrossRef] [Google Scholar]
All Tables
All Figures
|
Fig. 1 Infrared spectra of the clathrate kinetics experiment performed at 165K. Spectra extracted after 1, 30, and 100 days of exposure of the ice film to CO2 gas at 60 mbar are shown in the 4500–600 cm−1 range in the left panel. The upper trace is the spectrum recorded just after evacuation of the gas at the end of the experiment after 118 days. A close-up on the gas and clathrate hydrate signatures in the ν1 + ν3 and 2ν2 + ν3 combinationmodes is shown in the right panel. Under each spectrum is shown the baseline-corrected spectrum of the contribution by the CO2 in the clathrate cages after subtraction of the gas phase contribution to the spectrum. The CO2 signatures inthe small (SC) and large (LC) cages of the clathrate hydrate are labelled in the upper trace. The lower trace is a model of the CO2 gas phase at165K. See text for details. |
| In the text | |
|
Fig. 2 Schematic representation of the integrated column density measurement in the experiment and dimensions used in Eqs. (1)–(5). The gas (on the left) is in contact with the ice film (in blue). The clathration proceeds through the boundary (δ0), and the bulk clathration and diffusion evolves with time over the length L. The red line illustrates a snapshot of the clathrate concentration progression in the ice film. The infrared beam (red cylinder) probes the column density of clathrates formed in the entire film at a given time. |
| In the text | |
|
Fig. 3 Schematic representation of the incubation and nucleation, and diffusion-limited regimes. It is illustrated on the 165K CO2 clathrate time-dependent, integrated optical depth absorption curve evolution, as measured in the experiment. As time proceeds, we see the evolution of the degree of clathration (blue) of the ice film (light blue) when exposed to the CO2 gas in the pressurised cell. From left to right, the first inflexion shows the incubation time with an arrow, then JMAK surface clathration spreading and proceeding quickly from clathrate seeds, followed by diffusion-limited regimes of clathrate growth through the interface. |
| In the text | |
|
Fig. 4 Time-dependent evolution of the integrated optical depth of CO2 clathrate infrared signatures in the various experiments performed. The ν1 + ν3 mode (~ 3700 cm−1) is represented in blue. The 2ν2 + ν3 mode (~ 3590 cm−1) is represented in green. |
| In the text | |
|
Fig. 5 Diffusion coefficient retrieved from the analyses of the time-dependent FTIR spectra of the 2ν2 + ν3 (blue circle) and ν1 + ν3 (green square) CO2 caged in the clathrate hydrate (for the 155 K point the ν2 and ν3 modes wereused instead; see text). The data are fitted with an Arrhenius law shown by the dashed orange line. The red star indicates the expected temperature of the crossing point between the sublimation curve of pure CO2 and the stability curve of the CO2 clathrate hydrate below which the pure CO2 solid phase dominates the stability. |
| In the text | |
Current usage metrics show cumulative count of Article Views (full-text article views including HTML views, PDF and ePub downloads, according to the available data) and Abstracts Views on Vision4Press platform.
Data correspond to usage on the plateform after 2015. The current usage metrics is available 48-96 hours after online publication and is updated daily on week days.
Initial download of the metrics may take a while.