Open Access
Fig. 4
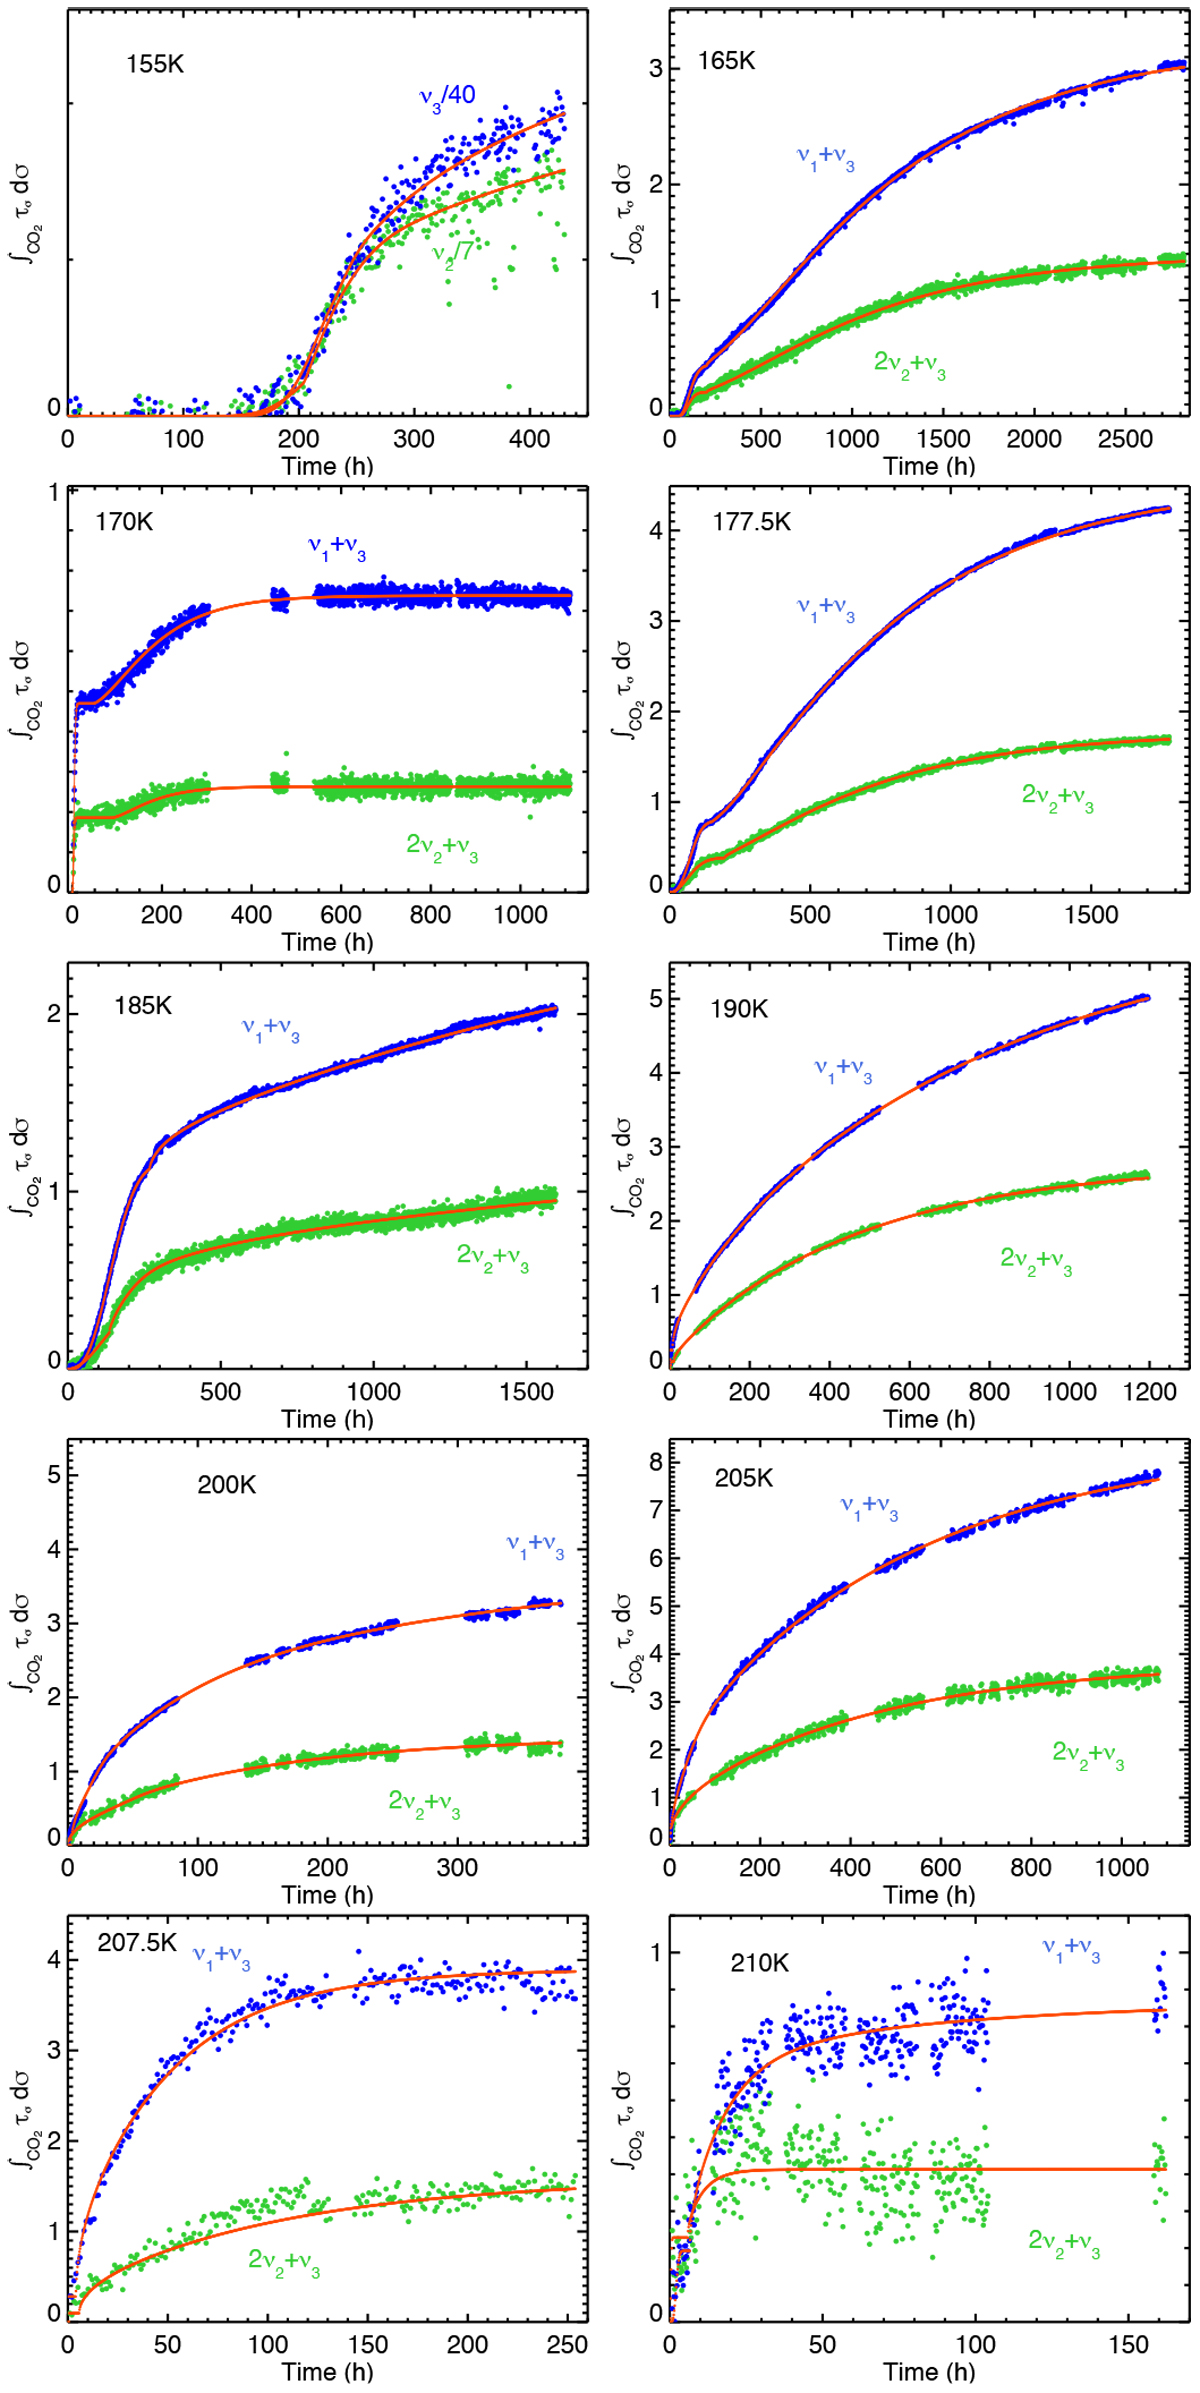
Time-dependent evolution of the integrated optical depth of CO2 clathrate infrared signatures in the various experiments performed. The ν1 + ν3 mode (~ 3700 cm−1) is represented in blue. The 2ν2 + ν3 mode (~ 3590 cm−1) is represented in green.
Current usage metrics show cumulative count of Article Views (full-text article views including HTML views, PDF and ePub downloads, according to the available data) and Abstracts Views on Vision4Press platform.
Data correspond to usage on the plateform after 2015. The current usage metrics is available 48-96 hours after online publication and is updated daily on week days.
Initial download of the metrics may take a while.