Fig. 3
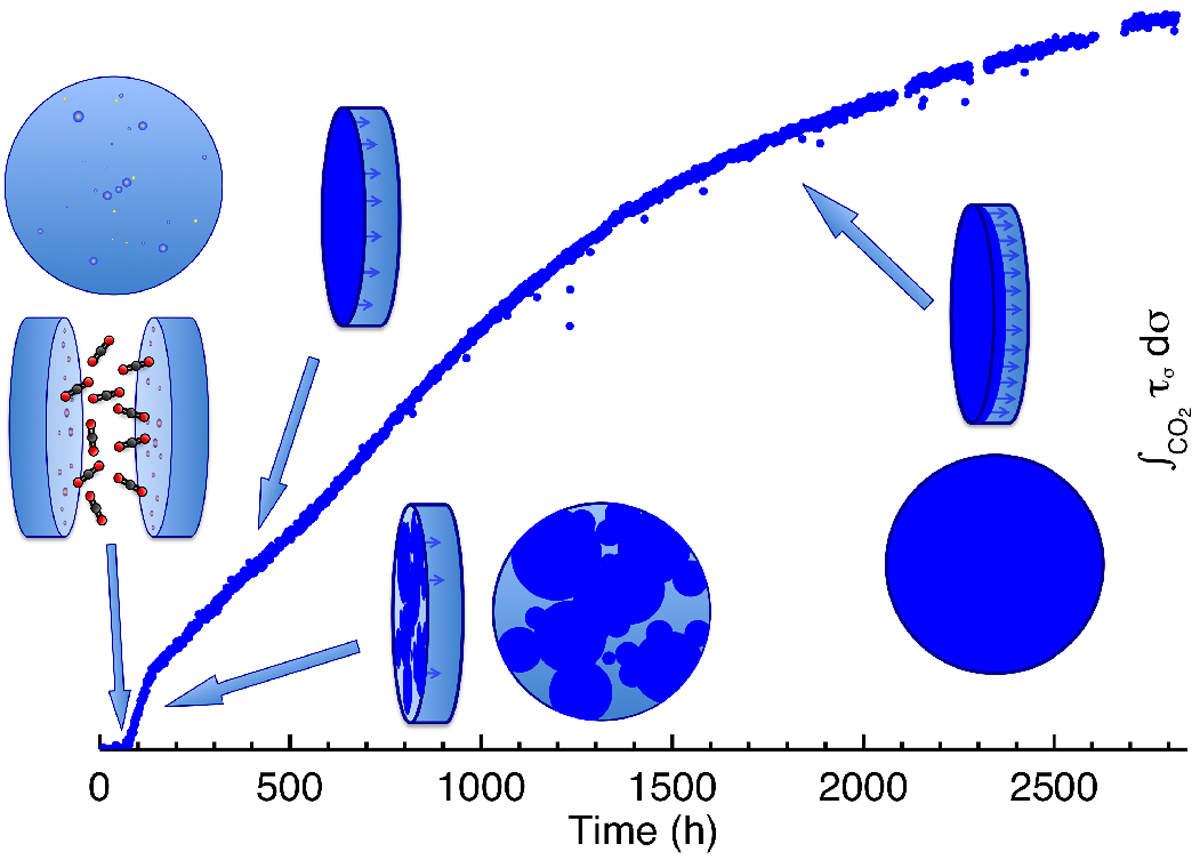
Schematic representation of the incubation and nucleation, and diffusion-limited regimes. It is illustrated on the 165K CO2 clathrate time-dependent, integrated optical depth absorption curve evolution, as measured in the experiment. As time proceeds, we see the evolution of the degree of clathration (blue) of the ice film (light blue) when exposed to the CO2 gas in the pressurised cell. From left to right, the first inflexion shows the incubation time with an arrow, then JMAK surface clathration spreading and proceeding quickly from clathrate seeds, followed by diffusion-limited regimes of clathrate growth through the interface.
Current usage metrics show cumulative count of Article Views (full-text article views including HTML views, PDF and ePub downloads, according to the available data) and Abstracts Views on Vision4Press platform.
Data correspond to usage on the plateform after 2015. The current usage metrics is available 48-96 hours after online publication and is updated daily on week days.
Initial download of the metrics may take a while.