Fig. 5
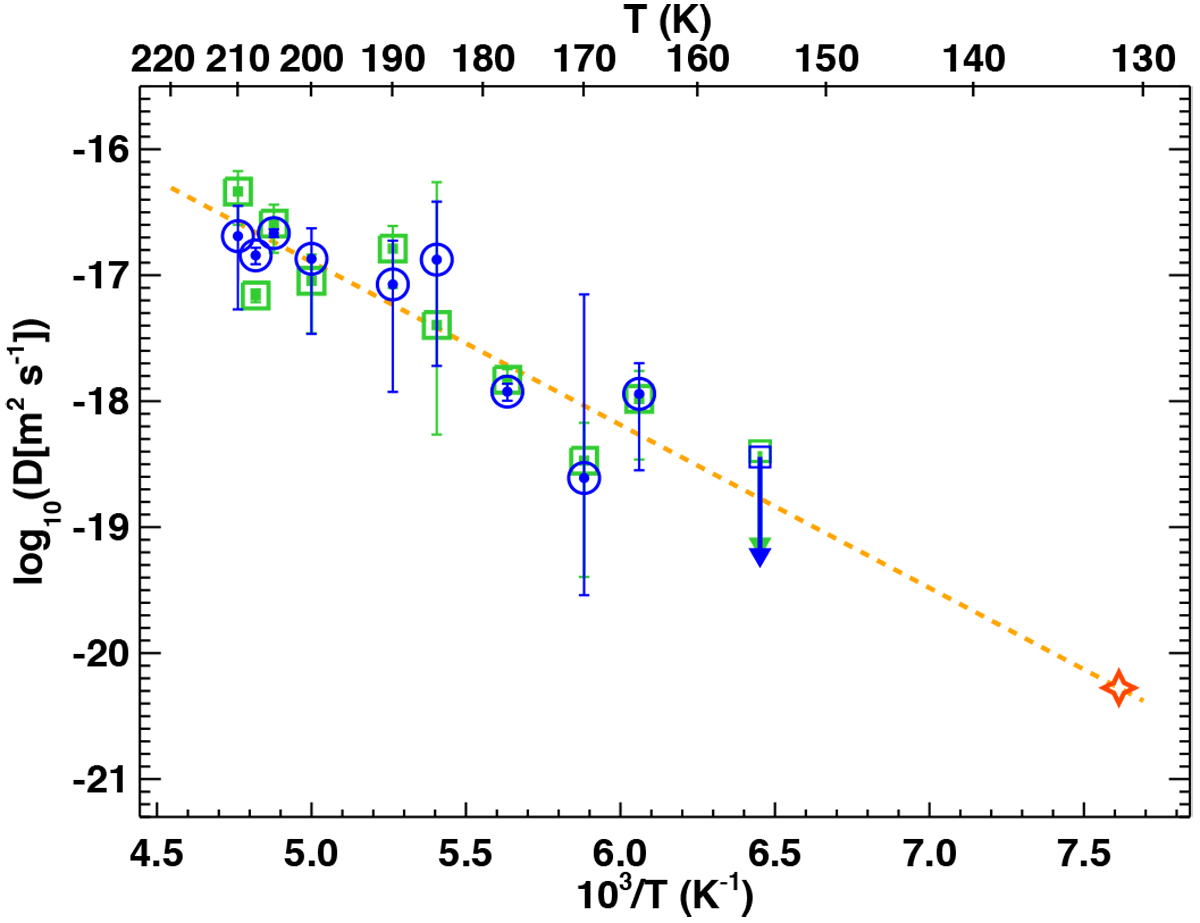
Diffusion coefficient retrieved from the analyses of the time-dependent FTIR spectra of the 2ν2 + ν3 (blue circle) and ν1 + ν3 (green square) CO2 caged in the clathrate hydrate (for the 155 K point the ν2 and ν3 modes wereused instead; see text). The data are fitted with an Arrhenius law shown by the dashed orange line. The red star indicates the expected temperature of the crossing point between the sublimation curve of pure CO2 and the stability curve of the CO2 clathrate hydrate below which the pure CO2 solid phase dominates the stability.
Current usage metrics show cumulative count of Article Views (full-text article views including HTML views, PDF and ePub downloads, according to the available data) and Abstracts Views on Vision4Press platform.
Data correspond to usage on the plateform after 2015. The current usage metrics is available 48-96 hours after online publication and is updated daily on week days.
Initial download of the metrics may take a while.