Fig. 1

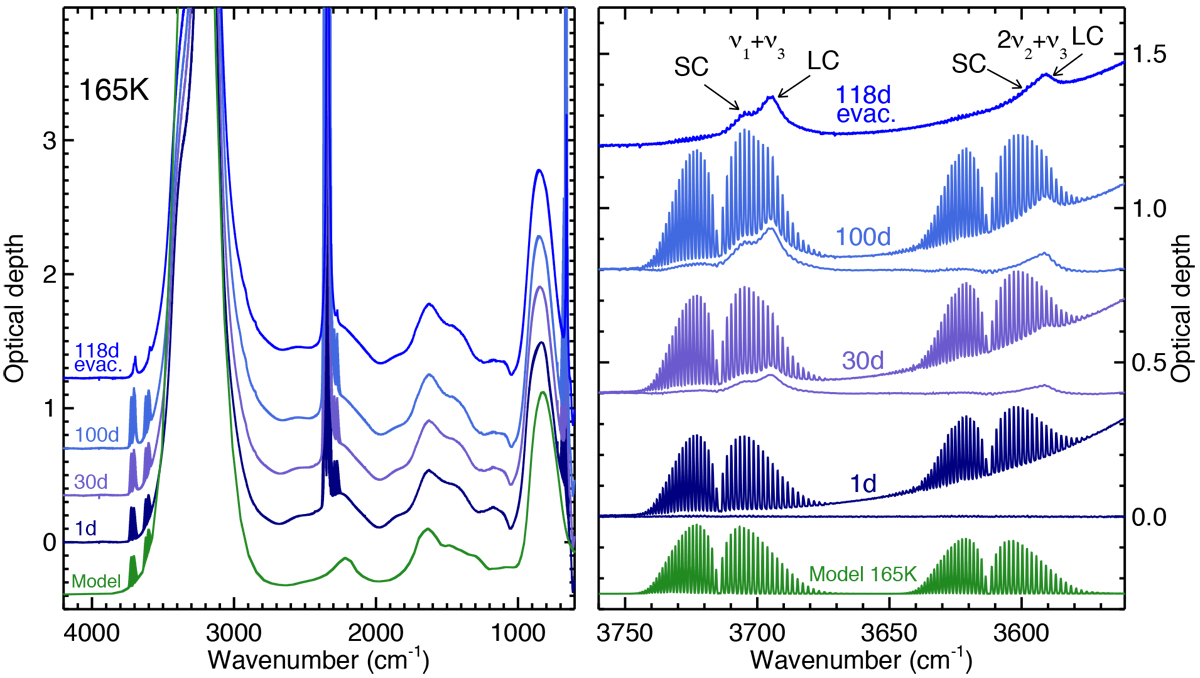
Infrared spectra of the clathrate kinetics experiment performed at 165K. Spectra extracted after 1, 30, and 100 days of exposure of the ice film to CO2 gas at 60 mbar are shown in the 4500–600 cm−1 range in the left panel. The upper trace is the spectrum recorded just after evacuation of the gas at the end of the experiment after 118 days. A close-up on the gas and clathrate hydrate signatures in the ν1 + ν3 and 2ν2 + ν3 combinationmodes is shown in the right panel. Under each spectrum is shown the baseline-corrected spectrum of the contribution by the CO2 in the clathrate cages after subtraction of the gas phase contribution to the spectrum. The CO2 signatures inthe small (SC) and large (LC) cages of the clathrate hydrate are labelled in the upper trace. The lower trace is a model of the CO2 gas phase at165K. See text for details.
Current usage metrics show cumulative count of Article Views (full-text article views including HTML views, PDF and ePub downloads, according to the available data) and Abstracts Views on Vision4Press platform.
Data correspond to usage on the plateform after 2015. The current usage metrics is available 48-96 hours after online publication and is updated daily on week days.
Initial download of the metrics may take a while.


