| Issue |
A&A
Volume 651, July 2021
|
|
|---|---|---|
| Article Number | L6 | |
| Number of page(s) | 9 | |
| Section | Letters to the Editor | |
| DOI | https://doi.org/10.1051/0004-6361/202141057 | |
| Published online | 09 July 2021 | |
Letter to the Editor
A major asymmetric ice trap in a planet-forming disk
II. Prominent SO and SO2 pointing to C/O < 1
1
Leiden Observatory, Leiden University, 2300 RA Leiden, The Netherlands
e-mail: This email address is being protected from spambots. You need JavaScript enabled to view it.
2
Physics & Astronomy Department, University of Victoria, 3800 Finnerty Road, Victoria, BC V8P 5C2, Canada
3
Max-Planck-Institut für Extraterrestrishe Physik, Gießenbachstrasse 1, 85748 Garching, Germany
4
RIKEN Cluster for Pioneering Research, 2-1, Hirosawa, Wako-shi, Saitama 351-0198, Japan
Received:
12
April
2021
Accepted:
7
June
2021
Abstract
Gas-phase sulphur-bearing volatiles appear to be severely depleted in protoplanetary disks. The detection of CS and the non-detections of SO and SO2 in many disks have shown that the gas in the warm molecular layer, where giant planets accrete their atmospheres, has a high C/O ratio. In this Letter, we report the detection of SO and SO2 in the Oph-IRS 48 disk using ALMA. This is the first case of prominent SO2 emission detected from a protoplanetary disk. The molecular emissions of both molecules is spatially correlated with the asymmetric dust trap. We propose that this is due to the sublimation of ices at the edge of the dust cavity and that the bulk of the ice reservoir is coincident with the millimetre-sized dust grains. Depending on the partition of elemental sulphur between refractory and volatile materials, the observed molecules can account for 15–100% of the total volatile sulphur budget in the disk. In stark contrast to previous results, we constrain the C/O ratio from the CS/SO ratio to be < 1 and potentially solar. This has important implications for the elemental composition of planets forming within the cavities of warm transition disks.
Key words: astrochemistry / techniques: interferometric / protoplanetary disks
Banting Research fellow.
© ESO 2021
1. Introduction
New planetary systems are made from dust and gas in the rotating disks around young stars. Elemental abundances and ratios such as C/O are key quantities in linking planet composition to their formation history (Öberg et al. 2011; Booth et al. 2017; Eistrup et al. 2018). Sulphur is a particularly interesting element for astrophysics, vulcanology on young planets, and formation of life, but its main reservoirs remain a puzzle. The depletion of elemental sulphur by one to three orders of magnitude in regions of dense gas has been an outstanding problem in astrochemistry for decades (e.g., Tieftrunk et al. 1994; Dutrey et al. 1997; Jenkins 2009). The bulk of the sulphur is thought to reside in refractory materials, but the exact reservoir is still unconfirmed (Keller et al. 2002; Woods et al. 2015). In dark clouds and young (< 1 Myr) Class 0/I sources, sulphur-bearing molecules are routinely detected in the gas phase, but their contribution to the total sulphur budget and chemical origin are still somewhat unclear (e.g., Artur de la Villarmois et al. 2019; Le Gal et al. 2020; Garufi et al. 2021). Regarding the ices, less is known aside from the direct detections of SO2 and OCS and an upper limit for H2S, which contributes to ≈5% of the total sulphur budget in protostars (Boogert et al. 1997, 2015). Indirectly, the ice composition can be inferred from observations of environments where ices sublimate (e.g., hot cores), and the gas detected in these systems suggests the presence of SO and SO2 ices (Drozdovskaya et al. 2018; Tychoniec et al. 2021).
In protoplanetary disks, a study of the elemental composition of the accreted disk material in the photospheres of Herbig Ae/Be stars shows that ≈89 ± 8% of the sulphur in disks is refractory (Kama et al. 2019). Therefore, a quest has been ongoing to detect different molecules to try to account for the total volatile fraction of sulphur in > 1 Myr protoplanetary disks especially as this is where gas-giant planets accrete the bulk of their atmospheres. Sulphur species may form hazes in the atmosphere (He et al. 2020), and they are important for pre-biotic chemistry (Ranjan et al. 2018). CS is most commonly detected, followed by H2CS (Le Gal et al. 2019; Codella et al. 2021; Fedele & Favre 2020); yet although CS is the most abundant sulphur species in protoplanetary disks, it only accounts for < 1% of the total sulphur budget. There are only a few sources with detections of SO, including the two Herbig disks, AB Aur and HD 100546 (Guilloteau et al. 2016; Fuente et al. 2010; Booth et al. 2018). There are one tentative detection of SO2 (Semenov et al. 2018) and one detection of H2S (Phuong et al. 2018).
Even though only a small fraction of volatile sulphur has been detected in disks so far, sulphur species have provided key insight into the elemental makeup of disks’ atmospheres. The CS/SO ratio has been proposed as a tracer of the underlying C/O ratio in the gas. Detections of CS and non-detections or tentative detections of SO and SO2 in many disks (LkCa 15, DM Tau, GO Tau, MWC 480, and PDS 70) indicate a high gas-phase C/O ratio, around unity, in the warm molecular layer (Dutrey et al. 2011; Semenov et al. 2018; Facchini et al. 2021). These observations directly probe where gas giant planets accrete their atmospheres (Morbidelli et al. 2014; Teague et al. 2019; Cridland et al. 2020). This high ratio is in line with the depletion of volatile C and O in disks that can be explained by the vertical mixing, radial transport, freeze-out, and subsequent chemical reprocessing of CO (e.g., Krijt et al. 2020), where more O than C is locked up in the ices. Observing sulphur species is therefore an extremely useful and complementary tool in constraining the bulk elemental composition of the gas in disks.
Here we present the first measurements of SO and SO2 in a disk that can be directly linked to an ice trap. Oph-IRS 48 is a 2.0 M⊙ Herbig A0 source located at 134 pc in the ρ Ophiuchus star-forming region (Brown et al. 2012; Gaia Collaboration 2018). This protostar is host to a transition disk with an extreme azimuthal asymmetry traced in the millimetre- to centimetre-sized grains (van der Marel et al. 2013, 2015), whereas the micron-sized grains are distributed axisymmetrically (Geers et al. 2007). The dust cavity extends out to 60 au and the gas cavity traced in CO to 25 au, with a depletion of gas in the cavity of ×103 relative to the ring (van der Marel et al. 2016). The disk is gas rich and warm, with detections of H2CO and the rarer CO isotopologues C18O and C17O (Bruderer et al. 2014; van der Marel et al. 2014, 2016). The bulk of the gas, traced in CO, is present throughout the entire azimuth of the disk, such as the micron-sized grains, whereas the H2CO was tentatively found to be co-spatial with the dust trap. This source presents a unique opportunity to study the chemistry associated with an exposed inner cavity edge and a high concentration of large icy dust grains. In van der Marel et al. (2021b; hereafter Paper I), we presented new detections of H2CO and CH3OH in the Oph-IRS 48 protoplanetary disk, and here in Paper II we present observations of the S-bearing molecules: SO2, 34SO2, SO, and CS. In Sect. 2 we outline these observations, and in Sect. 3 we show the resulting images and inferred column densities. In Sect. 4 we discuss the total volatile sulphur detected in the disk compared to the total sulphur budget, investigate the chemical origin of the detected species and the link to the dust trap, and provide key constraints on the C/O of the gas, which differ from those of other disks observed so far.
2. Observations
We utilised two sets of Band 7 observations of Oph-IRS 48 taken with the Atacama Large Millimeter/submillimeter Array (ALMA) during Cycles 2 and 5. The Cycle 2 programme, 2013.1.00100.S (PI: Nienke van der Marel), was carried out in June and August 2015 and was calibrated using the provided calibration scripts. These data cover one transition each of C18O, SO, and CS (see Table 1) and have a native channel width of 122 kHz, or ≈0.23 km s−1, and a spatial resolution of ≈0 2. The Cycle 5 programme, 2017.1.00834.S (PI: Adriana Pohl), was conducted in August 2018. Full details on the data calibration are available in Ohashi et al. (2020), where the continuum polarisation data are presented. This Letter focuses on the detection of two SO2 lines and one 34SO2 line (see Table 1) in these data. The detected H2CO and CH3OH lines are the focus of Paper I. These line data all have a channel width of 1953 kHz, or ≈1.7 km s−1, and a spatial resolution of ≈0
 5.
5.
Properties of the molecular lines and images analysed in this work.
We used the continuum images from both 2013.1.00100.S and Ohashi et al. (2020) as well as the higher spatial resolution Francis & van der Marel (2020) image to compare to the respective line images. All of the lines were imaged using CASA tCLEAN with a robust weighting of 0.5, a Keplerian mask (with an inclination angle of 50° and position angle of 100°; e.g., van der Marel et al. 2021a), a stellar mass of 2.0 M⊙, and a distance of 134 pc. Using the phase-centre variable in tCLEAN, the central position was set to ICRS 16h27m37.1797s, −24°30′35.480″, which was computed using the Gaia Data Release 2 position at the time of the observations (Gaia Collaboration 2018) for the Cycle 5 data.
The resulting beam sizes, peak emission, and per channel rms are listed in Table 1. All lines but the CS J = 7−6 line are robustly detected (> 3σ emission over three consecutive channels), and the channel maps for the detected lines are shown in Fig. A.1. For the CS, a 3σ upper limit on the disk integrated flux (see Table 1) was propagated from the rms noise in the channel maps following the method in Carney et al. (2019). To reduce the per channel rms and thus increase the signal-to-noise, the Cycle 2 SO 12–01 line was imaged at 1.7 km s−1. This also matches the spectral resolution of the Cycle 5 SO2 isotopologue lines.
3. Analysis
The Keplerian-masked integrated intensity maps for the C18O, SO2, 34SO2, and SO lines are presented in Fig. 1 alongside the ≈0 2 0.9 mm continuum. SO2 is clearly detected, and this is the first prominent detection of this molecule in a protoplanetary disk. The SO2, 34SO2, and SO maps all show central dips in emission and are all highly asymmetric, peaking in a similar azimuthal region of the disk as the millimetre-sized dust, much like the H2CO and CH3OH (see Paper I). This is in contrast to the C18O, which also shows a central cavity but is present throughout the full azimuth of the disk. To further investigate the spatial relationship between the dust and the sulphur-bearing molecules, radial and azimuthal profiles of both were generated. The radial profiles for the dust and molecular lines were averaged over a wedge from 100° to 260° relative to the north minor axis and are shown Fig. A.2. The errors are given by the standard deviation of the intensity of the pixels (0
 1 or 0
 05 for the SO) in each radial bin (0
 2 for the SO2 and 34SO2 and 0
 1 for the SO) divided by the square root of the number of beams per arc of the wedge. This highlights the spread in intensity values per bin rather than the intrinsic errors in the data themselves. In the lower resolution data the SO2 and 34SO2 lines peak just outside the dust radial peak, but the higher resolution SO line peaks at the same radial distance as the dust emission.
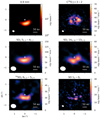 |
Fig. 1. Integrated intensity maps of the 0.9 mm continuum emission and detected lines listed in Table 1. The line maps are made with a Keplerian mask, and the synthesised beam is shown in the bottom left corner of each panel. |
The azimuthal profiles were extracted from an ellipse with the same position and inclination angle of the disk. For the SO2 and 34SO2 a de-projected radius of ≈70 au was chosen and for SO a radius of ≈90 au. The errors here were computed from the rms in the integrated intensity maps generated without a Keplerian mask. For comparison, the normalised azimuthal profile of the 0.9 mm dust from the respective observations is shown. The SO2 lines have a slightly wider azimuthal extent than the dust, and the optically thinner lines have slight dips where the dust emission peaks, potentially indicating continuum absorption of the line emission. This may indicate that for the SO2 the 53, 3–42, 2 line (Eup of 36 K) is optically thick higher above the dust τ = 1 surface, whereas the 144, 10–143, 11 line (Eup of 136 K) is coming from a deeper region of the disk along the observing line of sight. In Fig. A.3 we also show a comparison of the azimuthal profiles for the SO2 with the H2CO and CH3OH from Paper I and the 0.9 mm dust. Here, the H2CO and SO2 are seen to have the same azimuthal extent, but the CH3OH is more compact and follows the dust, similar to the higher resolution SO observations.
The total disk integrated line flux was extracted from the channel maps using a Keplerian mask and is listed in Table 1 with a 10% ALMA flux calibration error. These spectra are included in Fig. A.2. There is no evidence for an additional component of emission or broader line profiles than what would be expected from a disk, unlike what is seen for HD 100546 in SO (Booth et al. 2018).
We calculated the average column densities of SO2, 34SO2, and SO (and an upper limit on the CS column density) from the disk integrated fluxes. For this we assumed the line-emitting area to be the same as the 5σ extent of the 0.9 mm dust emission from Francis & van der Marel (2020, see our Fig. A.4). This is the same approach as in Paper I, and it is an area of 1.2 × 10⁻¹¹ steradians. Following the method outlined in Goldsmith & Langer (1999) and applied to disks (e.g., Loomis et al. 2018), we constructed an opacity-corrected rotational diagram for the SO2, which resulted in a rotational temperature of ≈100 K. This framework assumes local thermodynamic equilibrium and that the lines are optically thin to marginally optically thick. We also calculated column densities for 34SO2, SO, and CS assuming an excitation temperature of 50, 100, and 150 K. The last two are approximately the rotational temperatures derived for CH3OH and H2CO, respectively, in Paper I. The resulting values are listed in Table 2. The inferred SO2/32SO2 is only 2, compared to the value of 22 for the 32S/34S isotope ratio (e.g., Wilson 1999). This shows that the emission from the primary isotopologue, SO2, is optically thick. We therefore did not use the SO2 column density derived from the SO2 but rather that from the rarer isotopologue 34SO2. The ratio of CS/SO is < 0.01 and CS/SO2 < 0.02 (using the SO2 derived from the 34SO2). We note that as the inferred column densities are inversely proportional to the assumed emitting area, our results may be a conservative lower limit.
Derived column densities and ratios.
As a complementary check for optically thick SO2, we also calculated the brightness temperature of the 53, 3–42, 2 line. This was done by re-imaging the line before continuum subtraction, calculating the peak intensity map (moment 8), and then converting this to a brightness temperature under the Rayleigh-Jeans approximation. We find that this results in a low temperature with a peak of ≈7 K. This is most likely due to beam dilution as the emission is currently unresolved. A brightness temperature of ≈100 K would require an emitting area ≈15 times smaller than the 0 55 × 0
 44 beam of these data. Future 0
 1 data will allow this to be tested.
4. Discussion
4.1. Volatile sulphur in the IRS 48 disk
The bulk of the elemental sulphur in protoplanetary disks is thought to be in refractory materials (≈89 ± 8%) (Kama et al. 2019). Therefore, it is interesting to calculate what fraction of the expected volatile sulphur abundance in the IRS 48 disk can be accounted for by the SO and SO2 we detect. To estimate this, we took the total volatile sulphur to be the sum of the average SO2 (from the 34SO2) and SO column densities. The NH column density at 60 au from the IRS 48 disk model is 1.6 × 1022 cm−2, where the gas density structure is constrained from C17O observations (Bruderer et al. 2014; van der Marel et al. 2016). This results in a S/H ratio of 4.6–10.0 × 10⁻⁷ (depending on the excitation temperature; see Table 2), which is ≈15–100% of the total range in the volatile S budget estimated by Kama et al. (2019). Although we can account for the bulk of the volatile sulphur in the disk with just the SO and SO2 molecules, further observations targeting H2S and both oxygen- and carbon-bearing sulphur molecules (H2CS, CH3SH, OCS, and C2S) will provide the complete picture as to how the volatile sulphur is partitioned in this disk.
4.2. Chemical origin of the SO and SO2 in the IRS 48 disk
We find that SO and SO2 gas in the IRS 48 disk is co-spatial with the asymmetric dust trap. If the SO and SO2 form in the gas phase, then the key reactions are (e.g., Charnley 1997):


Therefore, gas-phase formation of SO and SO2 requires sufficient OH in the disk atmosphere. Interestingly, Herschel/PACS (The Photodetector Array Camera and Spectrometer) reported non-detections of both OH and H2O in the IRS 48 disk (Fedele et al. 2013). Additionally, as the molecules are co-spatial with the dust trap, this indicates that gas-grain processes are important to consider too. The alternative origin for the gas-phase SO and SO2 that we propose is from the sublimation of ices, particularly at the dust cavity wall (Cleeves et al. 2011; Booth et al. 2021). If the ice reservoir is constrained to the larger millimetre- and centimetre-sized dust grains, as suggested for TW Hya (Salinas et al. 2016; Walsh et al. 2016), then this would explain the morphology of the molecular emission we see towards IRS 48. This could be either from the direct sublimation of SO and SO2 ice or via gas-phase chemistry following the UV photo-dissociation of evaporated H2S and H2O ices. The sublimation temperatures of SO2 and H2CO are similar, so the azimuthal correlation of these species makes sense, and it follows that the CH3OH is more compact. As the SO data are of much higher spatial resolution and lower signal-to-noise, a direct comparison to the other line spatial morphologies is not particularly meaningful.
The vortex in the IRS 48 disk may also play a role in the chemistry. Vertical convection cells in the vortex might also transport icy material from the disk midplane up into the warm molecular layer, resulting in an increase in the sublimation of ices (Meheut et al. 2010), as also suggested for H2CO and CH3OH (see Fig. 4 in Paper I). In line with our results, exploratory chemical models from Dzyurkevich et al. (2020) show that SO is the primary S carrier in the gas phase in an IRS 48-like disk model. They also show that the SO2 abundance is sensitive to the dust-to-gas mass ratio in the disk; therefore, the SO/SO2 ratio may be a useful complementary tracer of the gas and dust properties of vortices.
A particular disk to compare to IRS 48 is AB Aur as they both host azimuthal dust traps. SO has been detected in AB Aur and shows a ring-like morphology (Rivière-Marichalar et al. 2020). SO emission over the full azimuth could be explained by AB Aur hosting a less azimuthally concentrated dust trap than in IRS 48 as the millimetre-sized grains are detected throughout the whole azimuth of the AB Aur disk (see Fig. 2 in van der Marel et al. 2021a for a comparison of the millimetre-sized dust emission from both disks – we note that this is not Paper I). Therefore, this is still consistent with our proposed scenario for the IRS 48 disk hosting a particularly massive ice trap with a low gas-to-dust ratio at the trap.
We derive a SO/SO2 ratio of 1.5–1.8 (see Table 2), which is closest to the values found for Hale-Bopp (SO/SO2 = 1.3; Bockelée-Morvan et al. 2000) and the Class I disk Elias 29 (SO/SO2 = 2.0; Oya et al. 2019). These values are a factor of a few higher than those measured in IRAS 16293-2422 B (SO/SO2 = 0.3) and the comet 67P (SO/SO2= 0.4−0.7) (Calmonte et al. 2016; Drozdovskaya et al. 2018). The chemistry in the disk is not solely due to thermal desorption but is also driven by the UV and X-ray irradiation fields. This would result in the photo-dissociation of SO2 to form SO, accounting for the higher SO/SO2 ratio we observe towards IRS 48 than towards IRAS 16293-2422 B. In photo-dissociation regions, this value is indeed higher, with, for example, SO/SO2 ≈ 10 in the Horsehead Nebula (Rivière-Marichalar et al. 2019) and ≈3 in the extended ridge of the Orion Bar, compared with 0.4 at the location of the hot core (Crockett et al. 2014).
4.3. Constraints on the C/O ratio of the gas
The non-detection of CS in a disk that is rich in emission from volatile sulphur molecules may appear puzzling. Our 3σ upper limit on the CS column density is at the high end of the values detected in other sources that cover more than one order of magnitude (×1012 − 1013 cm−2) (Semenov et al. 2018; Le Gal et al. 2019). In these other disks the inferred CS/SO ratios are > 1000 times higher than our observations (CS/SO < 0.01), and the detection of CS and the non-detection of SO (and SO2) have been used to infer the C/O ratio in the warm molecular layer. Chemical modelling shows that the CS/SO abundance ratio is the most sensitive to the overall C/O ratio in the gas rather than to other physical or chemical processes (e.g., grain growth, UV irradiation, and turbulent mixing; Semenov et al. 2018; Fedele & Favre 2020). Disk-specific modelling efforts show that CS/SO ratios of order 100 can be reproduced via gas-phase chemistry where the C/O ratio is super-solar (> 1; Dutrey et al. 2011; Semenov et al. 2018). Even in AB Aur, where SO is detected, an elevated C/O ratio of 1.0 is favoured in the chemical modelling (Rivière-Marichalar et al. 2020). Recent observations of the transition disk PDS 70 also report a CS/SO > 100, which is in line with a C/O > 1 (Facchini et al. 2021). This means that the bulk of gas accreted by forming planets in these disks is oxygen poor.
In the IRS 48 disk we have the opposite situation, where the CS/SO < 0.01 (see Table 2). From a comparison to chemical models, our column density ratios suggest a solar C/O ratio (Semenov et al. 2018). A complementary test of a high C/O ratio in IRS 48 would be the detection or non-detection of strong C2H emission (e.g., Bergin et al. 2016) and other oxygen-rich molecules, such as H2O. In general, the sublimation of ices at the edge of the cavity means that the gas accreted through the cavity onto potential forming planets will have a significantly different elemental composition than the gas accreted by a planet forming in a gap farther out in a disk. This is in contrast to what has been proposed for TW Hya (Bosman & Banzatti 2019), where the dust trap is beyond the CO ice line and thus the inner disk gas is volatile poor.
Another transition disk with an azimuthal asymmetry is HD 142527. CS has been detected in this disk and is also asymmetric, but it is anti-coincident with the dust trap peaking on the other side of the disk (van der Plas et al. 2014). The authors propose that this is due to either the lower temperatures in the dust trap resulting in the freeze-out of molecules or the high optical depth of the dust obstructing the line emission from the dust trap region. Alternatively, it could be tracing an azimuthal change in the C/O ratio, where C/O < 1 in the region of the dust trap due to the sublimation of ices.
5. Conclusions
In this Letter we have presented ALMA observations targeting the S-bearing molecules SO, SO2, and CS in the unique Oph-IRS 48 disk, which hosts a massive ice trap. We summarise our conclusions here:
-
This is the first robust detection of SO2 and the isotopologue 34SO2 in a Class II disk.
-
These oxygen-rich S-bearing molecules have a clear disk origin, unlike in other sources where they trace shocks, winds, or outflows.
-
As the sulphur species are co-spatial with the dust trap, we suggest that the presence of the gas-phase SO and SO2 is due to the sublimation of ices at the edge of the dust cavity and that the bulk of the ice reservoir is coincident with the millimetre-sized, and larger, dust grains.
-
We estimate the average S/H from the SO and SO2 column densities to be 4.6−10.0 × 10⁻⁷, and this is consistent with 15–100% of the total expected volatile sulphur budget in the disk.
-
Unlike all other protoplanetary disks targeted in these molecules so far, CS is not the primary S carrier in the gas phase. Additionally, the CS/SO ratio is < 0.01, in strong contrast to other disks.
-
The inferred gas-phase C/O ratio < 1 and is likely solar. We propose that this is due to the chemistry being driven by the sublimation of ices rather than gas-phase processes. This is a result of the unique nature of the extreme dust trap in the IRS 48 disk. This has important implications for the elemental composition of the atmosphere of gas-giant planets that may be forming or will form in this disk.
This work and Paper I further showcase the use of transition disks as unique observational laboratories to explore the full volatile inventory in disks due to the sublimation of ices at the cavity edge.
Acknowledgments
We would like to thank Akimasa Kataoka for his help with the reduction of the data. N. M. acknowledges support from the Banting Postdoctoral Fellowships program, administered by the Government of Canada. ALMA is a partnership of ESO (representing its member states), NSF (USA) and NINS (Japan), together with NRC (Canada) and NSC and ASIAA (Taiwan) and KASI (Republic of Korea), in cooperation with the Republic of Chile. The Joint ALMA Observatory is operated by ESO, AUI/ NRAO and NAOJ. This Letter makes use of the following ALMA data: 2013.1.00100.S, 2017.1.00834.S.
References
- Artur de la Villarmois, E., Jørgensen, J. K., Kristensen, L. E., et al. 2019, A&A, 626, A71 [NASA ADS] [CrossRef] [EDP Sciences] [Google Scholar]
- Bergin, E. A., Du, F., Cleeves, L. I., et al. 2016, ApJ, 831, 101 [NASA ADS] [CrossRef] [Google Scholar]
- Bockelée-Morvan, D., Lis, D. C., Wink, J. E., et al. 2000, A&A, 353, 1101 [Google Scholar]
- Boogert, A. C. A., Schutte, W. A., Helmich, F. P., Tielens, A. G. G. M., & Wooden, D. H. 1997, A&A, 317, 929 [NASA ADS] [Google Scholar]
- Boogert, A. C. A., Gerakines, P. A., & Whittet, D. C. B. 2015, ARA&A, 53, 541 [Google Scholar]
- Booth, R. A., Clarke, C. J., Madhusudhan, N., & Ilee, J. D. 2017, MNRAS, 469, 3994 [NASA ADS] [CrossRef] [Google Scholar]
- Booth, A. S., Walsh, C., Kama, M., et al. 2018, A&A, 611, A16 [NASA ADS] [CrossRef] [EDP Sciences] [Google Scholar]
- Booth, A. S., Walsh, C., Terwisscha van Scheltinga, J., et al. 2021, Nat. Astron. in press, [arXiv:2104.08348] [Google Scholar]
- Bosman, A. D., & Banzatti, A. 2019, A&A, 632, L10 [CrossRef] [EDP Sciences] [Google Scholar]
- Brown, J. M., Herczeg, G. J., Pontoppidan, K. M., & van Dishoeck, E. F. 2012, ApJ, 744, 116 [NASA ADS] [CrossRef] [Google Scholar]
- Bruderer, S., van der Marel, N., van Dishoeck, E. F., & van Kempen, T. A. 2014, A&A, 562, A26 [NASA ADS] [CrossRef] [EDP Sciences] [Google Scholar]
- Calmonte, U., Altwegg, K., Balsiger, H., et al. 2016, MNRAS, 462, S253 [CrossRef] [Google Scholar]
- Carney, M. T., Hogerheijde, M. R., Guzmán, V. V., et al. 2019, A&A, 623, A124 [NASA ADS] [CrossRef] [EDP Sciences] [Google Scholar]
- Charnley, S. B. 1997, ApJ, 481, 396 [NASA ADS] [CrossRef] [Google Scholar]
- Cleeves, L. I., Bergin, E. A., Bethell, T. J., et al. 2011, ApJ, 743, L2 [NASA ADS] [CrossRef] [Google Scholar]
- Codella, C., Podio, L., Garufi, A., et al. 2021, A&A, 644, A120 [Google Scholar]
- Cridland, A. J., Bosman, A. D., & van Dishoeck, E. F. 2020, A&A, 635, A68 [CrossRef] [EDP Sciences] [Google Scholar]
- Crockett, N. R., Bergin, E. A., Neill, J. L., et al. 2014, ApJ, 787, 112 [NASA ADS] [CrossRef] [Google Scholar]
- Drozdovskaya, M. N., van Dishoeck, E. F., Jørgensen, J. K., et al. 2018, MNRAS, 476, 4949 [NASA ADS] [CrossRef] [Google Scholar]
- Dutrey, A., Guilloteau, S., & Guelin, M. 1997, A&A, 317, L55 [NASA ADS] [Google Scholar]
- Dutrey, A., Wakelam, V., Boehler, Y., et al. 2011, A&A, 535, A104 [NASA ADS] [CrossRef] [EDP Sciences] [Google Scholar]
- Dzyurkevich, N., Lyra, W., & Majumdar, L. 2020, in Origins: From the Protosun to the First Steps of Life, eds. B. G. Elmegreen, L. V. Tóth, & M. Güdel, 345, 285 [Google Scholar]
- Eistrup, C., Walsh, C., & van Dishoeck, E. F. 2018, A&A, 613, A14 [NASA ADS] [CrossRef] [EDP Sciences] [Google Scholar]
- Facchini, S., Teague, R., Bae, J., et al. 2021, AJ, submitted [arXiv:2101.08369] [Google Scholar]
- Fedele, D., & Favre, C. 2020, A&A, 638, A110 [CrossRef] [EDP Sciences] [Google Scholar]
- Fedele, D., Bruderer, S., van Dishoeck, E. F., et al. 2013, A&A, 559, A77 [NASA ADS] [CrossRef] [EDP Sciences] [Google Scholar]
- Francis, L., & van der Marel, N. 2020, ApJ, 892, 111 [Google Scholar]
- Fuente, A., Cernicharo, J., Agúndez, M., et al. 2010, A&A, 524, A19 [NASA ADS] [CrossRef] [EDP Sciences] [Google Scholar]
- Gaia Collaboration (Brown, A. G. A., et al.) 2018, A&A, 616, A1 [NASA ADS] [CrossRef] [EDP Sciences] [Google Scholar]
- Garufi, A., Podio, L., Codella, C., et al. 2021, A&A, 645, A145 [EDP Sciences] [Google Scholar]
- Geers, V. C., Pontoppidan, K. M., van Dishoeck, E. F., et al. 2007, A&A, 469, L35 [NASA ADS] [CrossRef] [EDP Sciences] [Google Scholar]
- Goldsmith, P. F., & Langer, W. D. 1999, ApJ, 517, 209 [Google Scholar]
- Guilloteau, S., Reboussin, L., Dutrey, A., et al. 2016, A&A, 592, A124 [NASA ADS] [CrossRef] [EDP Sciences] [Google Scholar]
- He, C., Hörst, S. M., Lewis, N. K., et al. 2020, Nat. Astron., 4, 986 [Google Scholar]
- Jenkins, E. B. 2009, ApJ, 700, 1299 [NASA ADS] [CrossRef] [Google Scholar]
- Kama, M., Shorttle, O., Jermyn, A. S., et al. 2019, ApJ, 885, 114 [CrossRef] [Google Scholar]
- Keller, L. P., Hony, S., Bradley, J. P., et al. 2002, Nature, 417, 148 [NASA ADS] [CrossRef] [PubMed] [Google Scholar]
- Krijt, S., Bosman, A. D., Zhang, K., et al. 2020, ApJ, 899, 134 [Google Scholar]
- Le Gal, R., Öberg, K. I., Loomis, R. A., Pegues, J., & Bergner, J. B. 2019, ApJ, 876, 72 [Google Scholar]
- Le Gal, R., Öberg, K. I., Huang, J., et al. 2020, ApJ, 898, 131 [Google Scholar]
- Loomis, R. A., Cleeves, L. I., Öberg, K. I., et al. 2018, ApJ, 859, 131 [NASA ADS] [CrossRef] [Google Scholar]
- Meheut, H., Casse, F., Varniere, P., & Tagger, M. 2010, A&A, 516, A31 [NASA ADS] [CrossRef] [EDP Sciences] [Google Scholar]
- Morbidelli, A., Szulágyi, J., Crida, A., et al. 2014, Icarus, 232, 266 [NASA ADS] [CrossRef] [Google Scholar]
- Müller, H. S. P., Schlöder, F., Stutzki, J., & Winnewisser, G. 2005, J. Mol. Struct., 742, 215 [Google Scholar]
- Öberg, K. I., Murray-Clay, R., & Bergin, E. A. 2011, ApJ, 743, L16 [NASA ADS] [CrossRef] [Google Scholar]
- Ohashi, S., Kataoka, A., van der Marel, N., et al. 2020, ApJ, 900, 81 [Google Scholar]
- Oya, Y., López-Sepulcre, A., Sakai, N., et al. 2019, ApJ, 881, 112 [Google Scholar]
- Phuong, N. T., Chapillon, E., Majumdar, L., et al. 2018, A&A, 616, L5 [NASA ADS] [CrossRef] [EDP Sciences] [Google Scholar]
- Ranjan, S., Todd, Z. R., Sutherland, J. D., & Sasselov, D. D. 2018, Astrobiology, 18, 1023 [Google Scholar]
- Rivière-Marichalar, P., Fuente, A., Goicoechea, J. R., et al. 2019, A&A, 628, A16 [NASA ADS] [CrossRef] [EDP Sciences] [Google Scholar]
- Rivière-Marichalar, P., Fuente, A., Le Gal, R., et al. 2020, A&A, 642, A32 [EDP Sciences] [Google Scholar]
- Salinas, V. N., Hogerheijde, M. R., Bergin, E. A., et al. 2016, A&A, 591, A122 [NASA ADS] [CrossRef] [EDP Sciences] [Google Scholar]
- Semenov, D., Favre, C., Fedele, D., et al. 2018, A&A, 617, A28 [NASA ADS] [CrossRef] [EDP Sciences] [Google Scholar]
- Teague, R., Bae, J., & Bergin, E. A. 2019, Nature, 574, 378 [Google Scholar]
- Tieftrunk, A., Pineau des Forets, G., Schilke, P., & Walmsley, C. M. 1994, A&A, 289, 579 [Google Scholar]
- Tychoniec, L., van Dishoeck, E. F., van ’t Hoff, M. L. R., et al. 2021, A&A, submitted [Google Scholar]
- van der Marel, N., van Dishoeck, E. F., Bruderer, S., et al. 2013, Science, 340, 1199 [Google Scholar]
- van der Marel, N., van Dishoeck, E. F., Bruderer, S., & van Kempen, T. A. 2014, A&A, 563, A113 [NASA ADS] [CrossRef] [EDP Sciences] [Google Scholar]
- van der Marel, N., Pinilla, P., Tobin, J., et al. 2015, ApJ, 810, L7 [Google Scholar]
- van der Marel, N., van Dishoeck, E. F., Bruderer, S., et al. 2016, A&A, 585, A58 [NASA ADS] [CrossRef] [EDP Sciences] [Google Scholar]
- van der Marel, N., Birnstiel, T., Garufi, A., et al. 2021a, AJ, 161, 33 [Google Scholar]
- van der Marel, N., Booth, A. S., Leemker, M., et al. 2021b, A&A, 651, L5 (Paper I) [EDP Sciences] [Google Scholar]
- van der Plas, G., Casassus, S., Ménard, F., et al. 2014, ApJ, 792, L25 [Google Scholar]
- Walsh, C., Loomis, R. A., Öberg, K. I., et al. 2016, ApJ, 823, L10 [Google Scholar]
- Wilson, T. L. 1999, Rep. Prog. Phys., 62, 143 [Google Scholar]
- Woods, P. M., Occhiogrosso, A., Viti, S., et al. 2015, MNRAS, 450, 1256 [NASA ADS] [CrossRef] [Google Scholar]
Appendix A: Additional figures
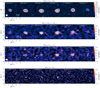 |
Fig. A.1. Channel maps of the detected SO, SO2, and 34SO2; the contours mark [3, 5, 7, 9, 15] × σ, where σ is the rms listed in Table 1. |
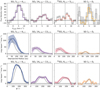 |
Fig. A.2. Spectra, radial and azimuthal proofiles of the lines detected in the IRS 48 disk. Top: spectra extracted from the Keplerian masks (colours) and a 1 |

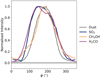 |
Fig. A.3. Normalised azimuthal profiles of 0.9 mm dust, H2CO (transition), CH3OH (transition), and SO2 (J = 53, 3 − 42, 2) lines taken at 70 au. The H2CO and CH3OH data are from van der Marel et al. (2021b). |
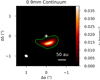 |
Fig. A.4. 0.9 mm continuum emission from Francis & van der Marel (2020). The green contour is the 5σ level and is the area used to calculate the column densities. |
All Tables
All Figures
|
Fig. 1. Integrated intensity maps of the 0.9 mm continuum emission and detected lines listed in Table 1. The line maps are made with a Keplerian mask, and the synthesised beam is shown in the bottom left corner of each panel. |
| In the text | |
|
Fig. A.1. Channel maps of the detected SO, SO2, and 34SO2; the contours mark [3, 5, 7, 9, 15] × σ, where σ is the rms listed in Table 1. |
| In the text | |
|
Fig. A.2. Spectra, radial and azimuthal proofiles of the lines detected in the IRS 48 disk. Top: spectra extracted from the Keplerian masks (colours) and a 1 |
| In the text | |
|
Fig. A.3. Normalised azimuthal profiles of 0.9 mm dust, H2CO (transition), CH3OH (transition), and SO2 (J = 53, 3 − 42, 2) lines taken at 70 au. The H2CO and CH3OH data are from van der Marel et al. (2021b). |
| In the text | |
|
Fig. A.4. 0.9 mm continuum emission from Francis & van der Marel (2020). The green contour is the 5σ level and is the area used to calculate the column densities. |
| In the text | |
Current usage metrics show cumulative count of Article Views (full-text article views including HTML views, PDF and ePub downloads, according to the available data) and Abstracts Views on Vision4Press platform.
Data correspond to usage on the plateform after 2015. The current usage metrics is available 48-96 hours after online publication and is updated daily on week days.
Initial download of the metrics may take a while.