Free Access
Fig. 1.
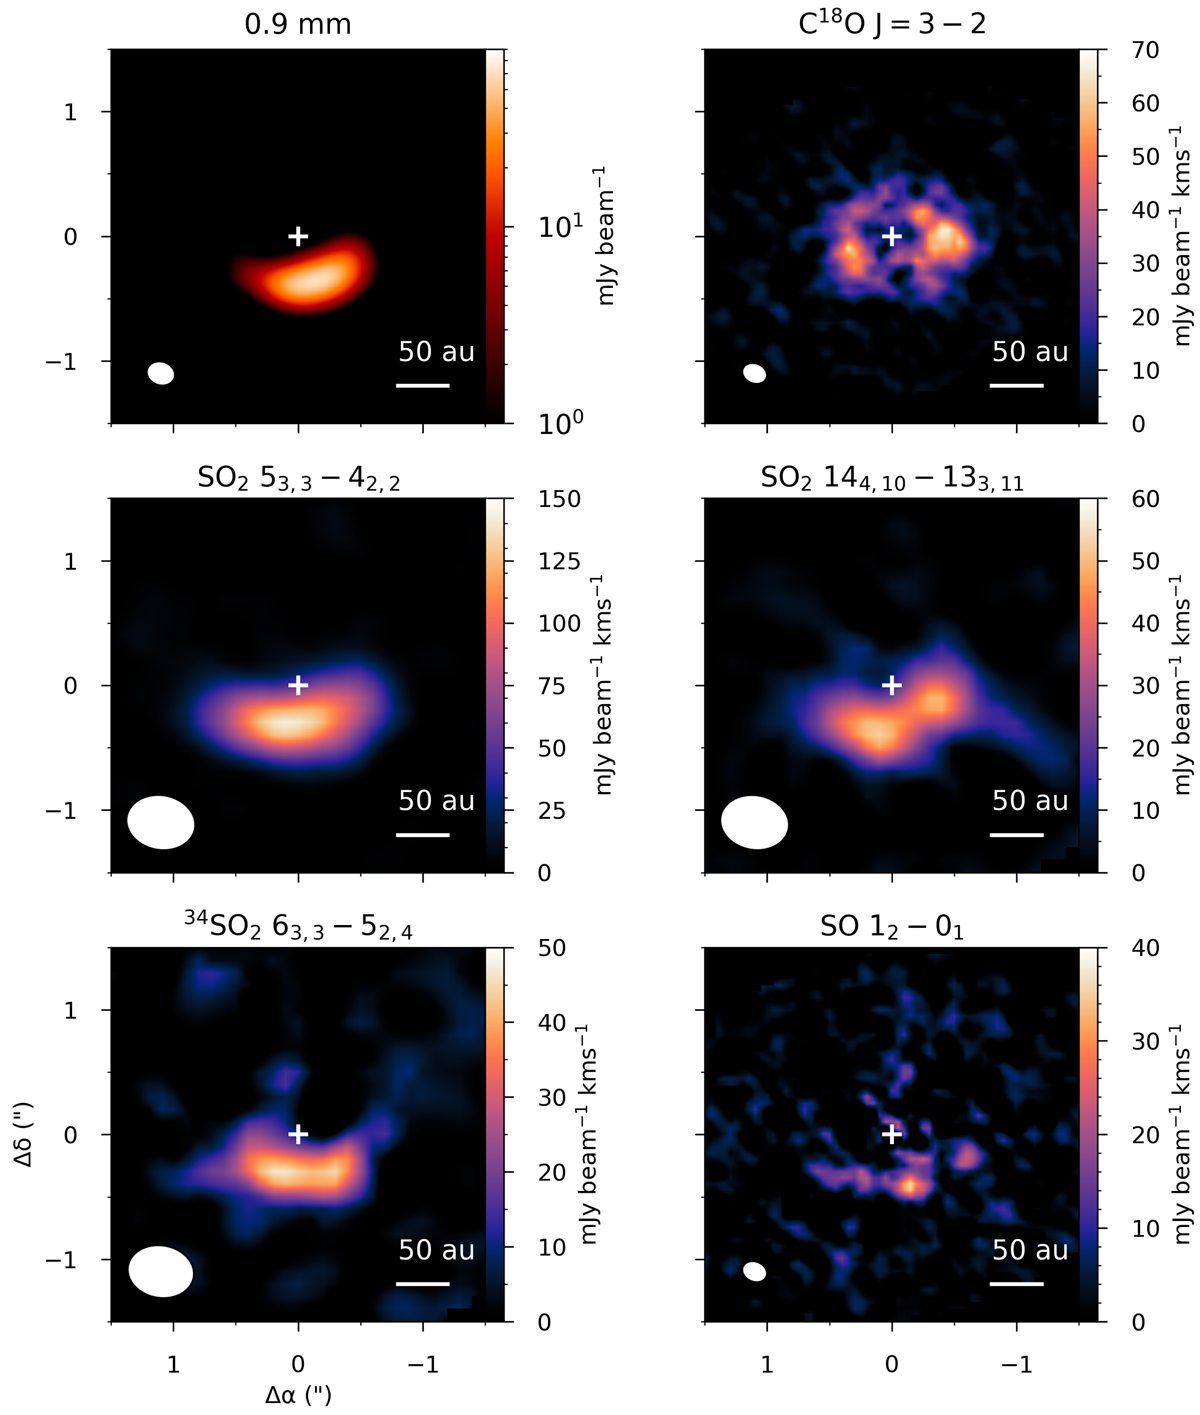
Integrated intensity maps of the 0.9 mm continuum emission and detected lines listed in Table 1. The line maps are made with a Keplerian mask, and the synthesised beam is shown in the bottom left corner of each panel.
Current usage metrics show cumulative count of Article Views (full-text article views including HTML views, PDF and ePub downloads, according to the available data) and Abstracts Views on Vision4Press platform.
Data correspond to usage on the plateform after 2015. The current usage metrics is available 48-96 hours after online publication and is updated daily on week days.
Initial download of the metrics may take a while.