Free Access
Fig. A.3.
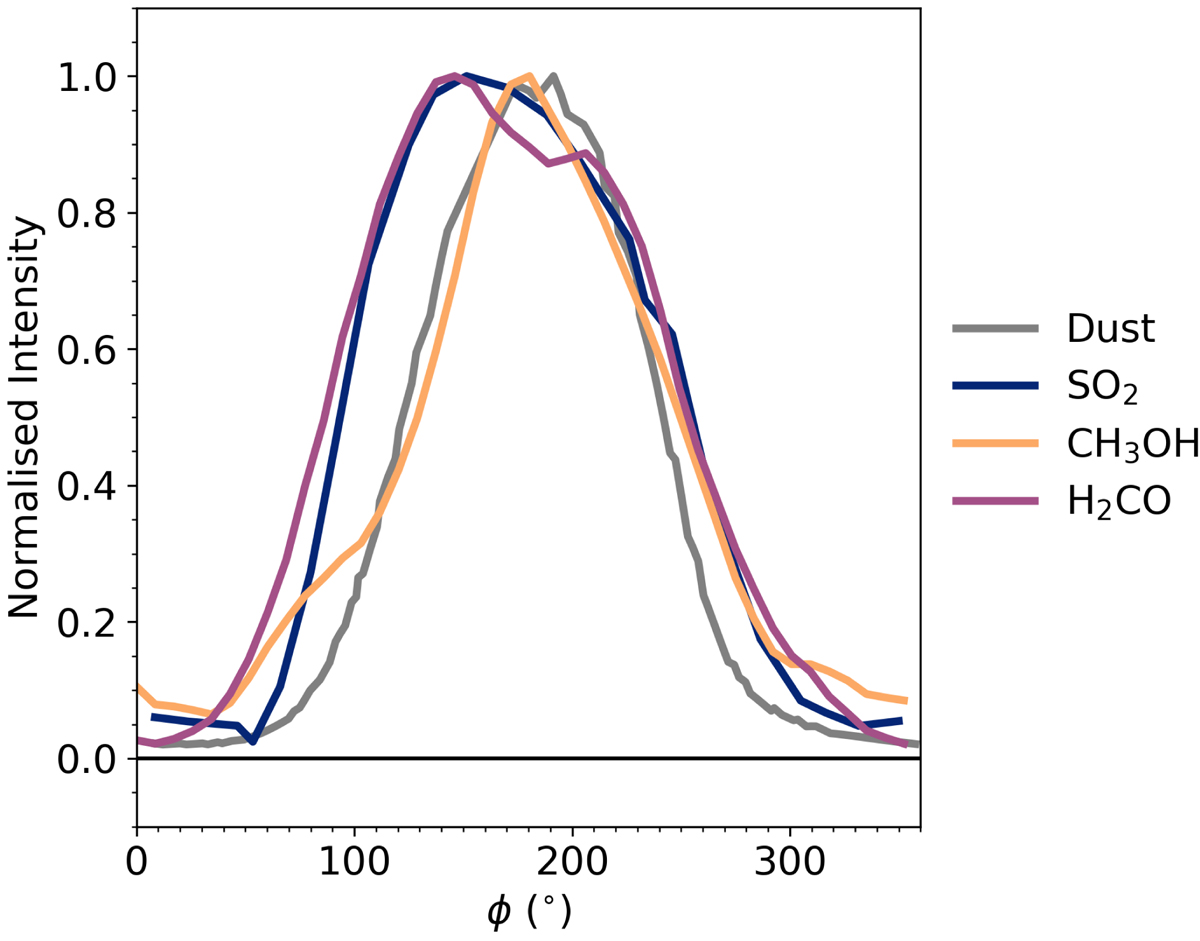
Normalised azimuthal profiles of 0.9 mm dust, H2CO (transition), CH3OH (transition), and SO2 (J = 53, 3 − 42, 2) lines taken at 70 au. The H2CO and CH3OH data are from van der Marel et al. (2021b).
Current usage metrics show cumulative count of Article Views (full-text article views including HTML views, PDF and ePub downloads, according to the available data) and Abstracts Views on Vision4Press platform.
Data correspond to usage on the plateform after 2015. The current usage metrics is available 48-96 hours after online publication and is updated daily on week days.
Initial download of the metrics may take a while.