Fig. A.2.
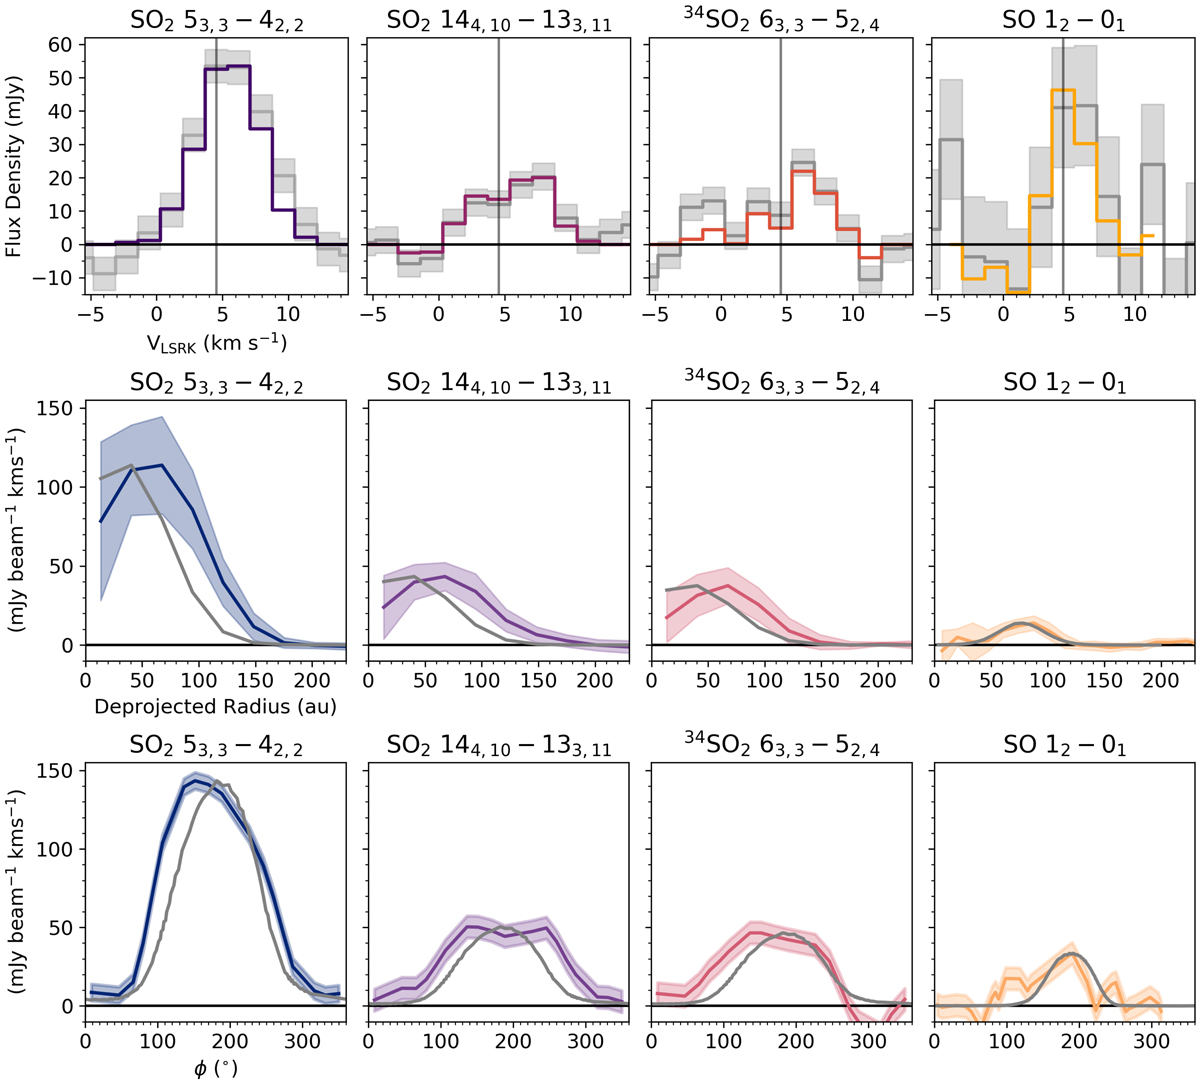
Spectra, radial and azimuthal proofiles of the lines detected in the IRS 48 disk. Top: spectra extracted from the Keplerian masks (colours) and a 1![]() 5 ellipse centred on-source (grey) with ±1σ error bars. The grey line marks the source velocity (4.55 km s−1). Middle: radial emission profiles averaged over a wedge from 100° to 260°. Grey profiles are the dust emission at the same resolution as the line data, and error bars on the line profiles are shaded regions. Bottom: azimuthal profiles extracted at a de-projected radius of 70 au for the SO2 lines and 90 au for the SO lines. The grey lines show the dust azimuthal profile extracted at the same radius for each line.
5 ellipse centred on-source (grey) with ±1σ error bars. The grey line marks the source velocity (4.55 km s−1). Middle: radial emission profiles averaged over a wedge from 100° to 260°. Grey profiles are the dust emission at the same resolution as the line data, and error bars on the line profiles are shaded regions. Bottom: azimuthal profiles extracted at a de-projected radius of 70 au for the SO2 lines and 90 au for the SO lines. The grey lines show the dust azimuthal profile extracted at the same radius for each line.
Current usage metrics show cumulative count of Article Views (full-text article views including HTML views, PDF and ePub downloads, according to the available data) and Abstracts Views on Vision4Press platform.
Data correspond to usage on the plateform after 2015. The current usage metrics is available 48-96 hours after online publication and is updated daily on week days.
Initial download of the metrics may take a while.