| Issue |
A&A
Volume 650, June 2021
|
|
|---|---|---|
| Article Number | A51 | |
| Number of page(s) | 8 | |
| Section | Extragalactic astronomy | |
| DOI | https://doi.org/10.1051/0004-6361/202140528 | |
| Published online | 07 June 2021 | |
A new distant giant radio galaxy in the Boötes field serendipitously detected by Chandra
1
SISSA – International School for Advanced Studies, Via Bonomea 265, 34151 Trieste, Italy
e-mail: This email address is being protected from spambots. You need JavaScript enabled to view it.
2
INAF – Osservatorio di Astrofisica e Scienza dello Spazio di Bologna, Via Gobetti 93/3, 40129 Bologna, Italy
3
INAF – Osservatorio Astronomico di Brera, Via E. Bianchi 46, 23807 Merate, Italy
4
INFN – National Institute for Nuclear Physics, Via Valerio 2, 34127 Trieste, Italy
5
IFPU – Institute for Fundamental Physics of the Universe, Via Beirut 2, 34151 Trieste, Italy
6
Astronomical Institute of the Czech Academy of Sciences, Boční II 1401/1A, 14000 Praha 4, Czech Republic
7
Leiden Observatory, Leiden University, PO Box 9513, 2300 RA Leiden, The Netherlands
Received:
10
February
2021
Accepted:
9
March
2021
Abstract
Context. Giant radio galaxies (GRGs) are the largest single structures in the Universe. Exhibiting extended radio morphology, their projected sizes range from 0.7 Mpc up to 4.9 Mpc. LOFAR has opened a new window on the discovery and investigation of GRGs and, despite the hundreds that are known today, their main growth catalyst is still under debate.
Aims. One natural explanation for the exceptional size of GRGs is their old age. In this context, hard X-ray selected GRGs show evidence of restarting activity, with the giant radio lobes being mostly disconnected from the nuclear source, if any are present at all. In this paper, we present the serendipitous discovery of a distant (z = 0.629), medium X-ray-selected GRG in the Boötes field.
Methods. High-quality, deep Chandra and LOFAR data allow for a robust study of the connection between the nucleus and the lobes, at a larger redshift, which has thus far been inaccessible to coded-mask hard X-ray instruments.
Results. The radio morphology of the GRG presented in this work does not show evidence for restarted activity and the nuclear radio core spectrum does not appear to be gigahertz-peaked spectrum (GPS)-like. On the other hand, the X-ray properties of the new GRG are perfectly consistent with the ones previously studied with Swift/BAT and INTEGRAL at lower redshift. In particular, the bolometric luminosity measured from the X-ray spectrum is a factor of six larger than the one derived from the radio lobes, although the large uncertainties make them formally consistent at 1σ. Finally, the moderately dense environment around the GRG, traced by the spatial distribution of galaxies, supports recent findings that the growth of GRGs is not primarily driven by underdense environments.
Key words: galaxies: active / galaxies: general / X-rays: galaxies / radio continuum: galaxies / galaxies: jets
© ESO 2021
1. Introduction
Giant radio galaxies (GRGs) are the biggest single structures in the Universe. They are conventionally defined as extragalactic radio sources whose projected linear size on the sky is larger than 0.7 Mpc. Although GRGs have been well known for decades (e.g., Willis et al. 1974), these spectacular objects have recently significantly grown in number thanks to sensitive low-frequency radio surveys, such as the LOFAR (van Haarlem et al. 2013) Two-metre Sky Survey (LoTSS; Shimwell et al. 2017). With hundreds of GRGs having been discovered (Dabhade et al. 2020a), the main drivers of their large spatial growth have begun to be investigated on a statistical basis. The reason for which GRGs are able to achieve such sizes is not yet clear. The physical explanations for the exceptional size of GRGs that are currently considered plausible are: (1) they could be very old radio galaxies, which would give their lobes enough time to expand in the circumgalactic medium, (2) they could have incredibly efficient and collimated relativistic jets, or (3) perhaps there is a sufficiently low-density environment around the GRG that allows the jets and lobes to propagate and expand almost freely.
Recent studies have found increasing evidence that the environment of a GRG does not play a significant role in its growth and that underdense environments are not necessarily required to grow a radio galaxy to giant size. In fact, Dabhade et al. (2020a) found that ∼10% of LOFAR GRGs reside in clusters, which are dense environments (see also Tang et al. 2020); furthermore, Lan & Prochaska (2021) explored the position of ∼100 GRGs in the cosmic web and their satellites properties, finding consistency with the results for optically and radio selected control samples matched in luminosity and color. This is in contrast to regular radio galaxies, for which the environment does have an effect on their properties (e.g., Croston et al. 2019; Massaro et al. 2020; Moravec et al. 2020). Interestingly, while the environmental factor appears to be negligible, evidence has been recently found that selecting GRGs in the hard X-ray band could provide meaningful insights about their origin. For instance, Ursini et al. (2018) focused on a sample of local (z < 0.24) hard X-ray selected GRGs (Bassani et al. 2016, 2021) finding that their nuclei are powered by radiatively efficient accretion and that their nuclear X-ray luminosity is larger than the jet power derived from the lobes, hinting to an old lobes and restarted nuclear activity scenario. Such a scenario has been further supported by Bruni et al. (2020), who found morphological evidence that the vast majority of hard X-ray selected GRGs could be restarting their nuclear activity, their giant radio lobes being the relics of past accretion episodes.
Given these interesting recent results, studying the X-ray properties of GRGs in softer bands becomes important, as the hard X-ray selected ones are intrinsically the brightest of the population at any redshift and may show a different behavior with respect to their lower (X-ray) luminosity counterparts. Furthermore, investigating GRGs in softer X-ray bands could provide a better statistical estimate of their number at higher redshifts.
Here, we report the serendipitous discovery of a new distant GRG in the NOAO Deep-Wide Field Survey Boötes field (Jannuzi & Dey 1999). Thanks to the wide field area (∼9.3 deg2) and superb multi-wavelength coverage, it has a great potential for discovery, enhanced by the recent addition of LOFAR observations at 150 MHz (Williams et al. 2016; Retana-Montenegro et al. 2018; Tasse et al. 2021) and deep Chandra coverage (Masini et al. 2020). Despite being previously detected in the shallow Chandra XBOOTES survey with just five photons (Murray et al. 2005; Kenter et al. 2005), the nuclear source (also known as CXOXB J143009.8+351957 – J1430, hereafter) is now firmly detected with 74 counts over the 0.5–7 keV band and coincides with the geometric center of a spectacular radio structure, extended for ∼4′, seen in the LOFAR image at 150 MHz (Fig. 1). Given its spectroscopic redshift (z = 0.629, Kochanek et al. 2012), J1430’s extension reaches ∼1.66 Mpc. As pointed out above, the Chandra detection allows us to probe a lower X-ray luminosity regime inaccessible at the same redshift with hard X-ray coded-mask instruments such as Swift/BAT and INTEGRAL.
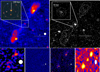 |
Fig. 1. Multi-wavelength images of the GRG. Top left: LOFAR 150 MHz (Tasse et al. 2021) cutout of the GRG, where the white ellipse labels the beam size of the instrument. The inset shows the optical composite grz DECaLS (Dey et al. 2019) DR8 image, with the white circle marking 100 projected kpc from the galaxy. Top right: Chandra 0.5–7 keV (Masini et al. 2020) cutout of the GRG, spatially rebinned with a 4 × 4 pixel scale, with the white LOFAR contours overlaid. The X-ray image demonstrates that the core is clearly detected, unlike the lobes and hotspots. The inset shows a zoom-in on the core, with a native Chandra pixel scale. The dashed white circle in the inset labels the PSF size encircling ∼90% of the counts. Hence, the X-ray emission is consistent with being point-like. Bottom row: radio cutouts. In all the images, the white ellipses label the beam size of the instrument. From left to right: GMRT 150 MHz (Williams et al. 2013), VLA 325 MHz (Coppejans et al. 2015), GMRT 608 MHz (Coppejans et al. 2016), WSRT 1.4 GHz (de Vries et al. 2002). While all three components (core and lobes or hotspots) are detected at 608 MHz and 1.4 GHz, only the lobes are detected by GMRT at 150 MHz and the whole GRG is undetected by VLA at 325 MHz. |
The paper is structured as follows. In Sect. 2, we describe the radio properties of the new GRG we discovered, while in Sect. 3, we focus on its X-ray spectral properties. In Sect. 4, we estimate the bolometric luminosity and the accretion rate of the AGN using different indicators. In Sect. 5, we investigate the large-scale environment around the GRG. In Sects. 6 and 7, the discussion and summary of our findings are presented. In this work, we assume a flat ΛCDM cosmology with H0 = 69.6 km s−1 Mpc−1 and ΩM = 0.286. Unless otherwise stated, uncertainties are quoted at a 68% level of confidence throughout the paper.
2. Radio properties of J1430
Recent work has shown that the vast majority of hard X-ray/soft γ-ray selected GRGs show either restarted radio morphology, such as double-double lobes or x-shaped morphology, or nuclear radio spectra that resemble gigahertz-peaked sources (GPS-like), which suggest that the nuclear emission may be young (Bruni et al. 2020). In our case, J1430 has been detected in the medium X-ray band with Chandra instead. Given the wide frequency coverage of the Boötes field, J1430 is present in different radio catalogs, from 150 MHz up to 31 GHz. The available radio cutouts are shown in the bottom row of Fig. 1. The GMRT 150 MHz image (Williams et al. 2013) shows a ∼3.5σ detection of the northern lobe and a possible hint for the southern lobe, but no core emission is detected. The VLA 325 MHz image (Coppejans et al. 2015) shows no detection based on peak flux, but possibly very low surface brightness extended emission. The GMRT 608 MHz image (Coppejans et al. 2016) clearly detects the core and the hotspots of the lobes; the same holds for the WSRT 1.4 GHz image (de Vries et al. 2002). Recently, new deep LOFAR data on this field have been released (Tasse et al. 2021), with improved image quality thanks to a direction-dependent calibration and reaching a RMS level of 30 μ Jy beam−1, the best so far for this field (see Fig. 10 of Tasse et al. 2021). The total integration time of 80 h has been spread over eight scans of 10 h each, covering almost 70 deg2 of area observed at full resolution of 6″ × 6″. The exquisite LOFAR image at 150 MHz, shown in the top left panel of Fig, 1, shows prominent lobes with bright hotspots, as usually happens in FRII (Fanaroff & Riley 1974) radio galaxies. The hotspots almost symmetrically bracket the radio core emission, and there is a hint in support of the radio jets.
We notice that there is some radio diffuse emission in the lobes extending well beyond the hotspots (∼332 kpc and ∼166 kpc beyond the northern and southern hotspots, respectively), which could trace an older population of radio-emitting electrons and could represent the relic of a past emission with very similar jet orientation. Even if the lobes and the hotspots could be associated with two different accretion episodes, their temporal separation (few Myr, assuming the same propagation speed of ∼0.1c) would be much smaller than the age of the last accretion episode. Given its size, D, and 1.4 GHz power, P, J1430 would lie among the other GRGs in the well-known P − D diagram. In particular, it would be consistent with the evolution of a 1045 erg s−1 jet after ∼400 Myr in the framework of Hardcastle (2018). Furthermore, the recessed hotspots could also be due to the bending of the jets along our line of sight if, for instance, J1430 is moving through some dense environment in a perpendicular sense to the plane of the sky.
In summary, because the hotspots are both > 500 kpc away from the nucleus already, there is no conclusive morphological evidence for any recently restarted activity. The extended emission dominates the total radio flux up to at least 1.4 GHz (the core dominance parameter is 0.14 ± 0.01). Its bright low-frequency emission results in a radio slope between 150 MHz and 1.4 GHz (defining fν ∝ να) α = −1.09 ± 0.02, which is consistent with the bulk of the GRGs population reported by Dabhade et al. (2020a). Furthermore, the radio core spectrum is rather flat: a log-linear fit to the core data (green and grey points in Fig. 2) between 150 MHz and 31 GHz, assuming that the 5 and 31 GHz fluxes are dominated by the core and no lobes contribution is present, returns a slope of αCore = 0.01 ± 0.07. The general radio properties of J1430 appear to be typical of a normal-sized FRII and if the redshift were much lower (z < 0.17)1, this object would be classified as a local FRII.
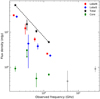 |
Fig. 2. Radio spectrum of the GRG, with flux densities measured at LOFAR 150 MHz (Tasse et al. 2021), VLA 325 MHz (Coppejans et al. 2015), GMRT 608 MHz (Coppejans et al. 2016), WSRT 1.4 GHz (de Vries et al. 2002), VLA 5 GHz (Muchovej et al. 2010), and SZA 31 GHz (Muchovej et al. 2010). The green filled circles mark the core data up to 1.4 GHz (the VLA 325 MHz data point being a 3σ upper limit), while the blue diamonds and red squares refer to the southern and northern lobes, respectively, and have been slightly shifted in frequency to improve the clarity of the plot. The black stars label the total emission from the three components, fit by a power law of slope ∼ − 1 (black dashed line). At higher frequencies (gray circles), the emission is likely dominated by the core, which shows a flat spectrum across the whole range of frequencies. |
3. X-ray properties of J1430
A great deal of information about the physical mechanisms taking place in the vicinity of the AGN can be obtained by studying its X-ray spectrum. The core of J1430, coincident with the optical position of the host galaxy, was detected as part of the Chandra Deep Wide-Field Survey (Masini et al. 2020), with 74 photons in the 0.5–7 keV band, corresponding to a significance of ∼8σ, while the hotspots and the lobes are undetected in X-rays. The spectrum was extracted with the CIAO (Fruscione et al. 2006) v4.12 task specextract and analyzed with XSPEC (Arnaud 1996) v.12.9.1. The spectrum was rebinned with grppha to have at least one count per bin, and the Cash statistic (Cash 1979) was adopted during the fit. The Galactic column density at the position of the source is NH, Gal = 1.17 × 1020 cm−2 (Kalberla et al. 2005).
3.1. X-ray spectral analysis
When fit with a simple power law absorbed by a Galactic column density, the photon index is very hard (Γ = 0.30 ± 0.25), indicative of the presence of substantial absorption along the line of sight (or substantial reflection above a few keV). Although the fit is formally acceptable (CSTAT/d.o.f. = 53/66), such a hard power law is very atypical; given the fact that J1430 is an FR II, some degree of obscuration along the line of sight may be expected and it can reach quite substantial values (e.g., NH ≳ 1023 cm−2; Belsole et al. 2006; Evans et al. 2006).
Thus, a more realistic model including photoelectric absorption and Compton scattering was adopted. We also modeled the possibility that a small fraction of the primary coronal power law is scattered into our line of sight, represented by a soft component arising below a few keV in the spectrum. The parameters of such a scattered power law are fixed to the ones of the primary continuum. The XSPEC implementation of this phenomenological model is the following:
 (1)
(1)
The presence of a scattered power law is required by the data at 98% confidence level, with a scattered fraction of  , consistently with the values commonly observed in local obscured Seyferts (e.g., Ricci et al. 2017). The best-fit (CSTAT/d.o.f. = 47/64) photon index is much more reasonable despite the large uncertainty (Γ = 2.0 ± 0.8), which reflects in the large uncertainty on the column density (
 cm−2). The two parameters are degenerate, with harder slopes coupled to lower absorption. When an AGN is obscured by a large amount of gas, a narrow Fe Kα line at 6.4 keV is commonly observed due to fluorescence of Fe atoms in the dusty torus. We thus added a narrow Gaussian line at 6.4 keV and tested if the data require its presence, and how significant it would be. Due to the low photon statistics, the line is not statistically significant (CSTAT/d.o.f. = 46/63), with an equivalent width (EW) of
  eV. Similarly, a cold reflection component (i.e., pexrav; Magdziarz & Zdziarski 1995) is not required by the data, leaving the fit statistic unchanged.
To have a better physical description of the X-ray spectrum, we check the results obtained with the previous model with Monte-Carlo based toroidal models commonly adopted in the literature, such as MYTorus (Murphy & Yaqoob 2009) and Borus02 (Baloković et al. 2018). They both assume a smooth medium (although with different geometry) surrounding a central, isotropic source of X-rays, and self-consistently treat absorption, scattering, and fluorescence. A standard MYTorus model is implemented in XSPEC as follows:
 (2)
(2)
A fit with this model (CSTAT/d.o.f. = 47/64) returns a photon index Γ = 2.0, although unconstrained (the fit is largely insensitive to its exact value), with  cm−2 and a soft power law scattered fraction of
  . The best-fit MYTorus model is shown in Fig. 3. Perfectly consistent results were obtained with the Borus02 model and confirm the picture provided earlier by the obscured power law model.
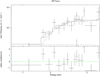 |
Fig. 3. Unfolded spectrum of J1430 with the best-fit MYTorus model. The solid black line marks the total model, the dashed components are the transmitted and line components of the MYTorus model, while the dot-dashed line labels the soft scattered power law. The curvature of the spectrum below ∼5 keV implies moderate obscuration. |
In summary, J1430 is heavily obscured with a photon index that, despite unconstrained, has a best-fit value consistent with the general, radio-quiet, AGN population. A very useful quantity that can be directly measured from an accurate X-ray spectral analysis is the intrinsic (i.e., corrected for absorption) X-ray luminosity of the source. The MYTorus model returns an intrinsic 2–10 keV flux of FX ∼ 7.8 × 10⁻¹⁴ erg cm−2 s−1, implying a rest-frame, intrinsic 2–10 keV luminosity of LX = 1.3 ± 0.5 × 1044 erg s−1. The uncertainties over the luminosity are computed from the joint photon index and power law normalization uncertainties, following Boorman et al. (2016) and Masini et al. (2019). The measured X-ray luminosity of J1430 is perfectly consistent with the other hard X-ray selected GRGs (Ursini et al. 2018): the higher sensitivity of Chandra allowed us to detect and study a similar object at a larger redshift. The results shown above confirm that the nucleus of J1430 is actively accreting; the accretion rate can be constrained combining the bolometric luminosity of the system and the black hole mass. We derive them both in the following section.
3.2. Radio-loudness and jet component in the X-ray spectrum
Based on the measured column density, we expect the optical light of the AGN to be heavily extincted (this is indeed confirmed by the results given in Sect. 4.3); thus, the most suitable radio loudness parameter in this case is the one defined by Terashima & Wilson (2003), which exploits the radio to X-ray ratio: log RX = νLν, 5 GHz/LX, with a radio-loud threshold set at log RX ≳ −4.5. We use the rest frame, de-absorbed 2–10 keV X-ray luminosity to compute the radio loudness, and interpolate the flat radio core spectrum at the observed frequency of ∼3 GHz. The observed log RX ∼ −3.6 confirms that J1430 is radio loud: hence, the unobscured X-ray component arising below few keV could be attributable to the contribution by a relativistic jet. However, the number of collected photons is too small to have a robust detection of a putative jet component. We note that based on the observed radio loudness and the relation presented by Miller et al. (2011), the X-ray excess due to the jet contribution should be around ∼50%, albeit with a large uncertainty.
4. Bolometric luminosity
The total (bolometric) luminosity is one of the most important quantities that describe an AGN, as a measurement of the power emitted from the system and directly connecting it to the accretion mode of the central engine once the black hole mass has been estimated. To have a thorough view of the accretion state of our GRG, in this section, we derive its bolometric luminosity through different, widely used tracers and combine them with an estimate of the black hole mass to derive the accretion rate in Eddington units.
4.1. From X-ray spectroscopy
It is widely known that in radio-quiet AGNs, the X-ray luminosity is tightly correlated with its bolometric luminosity (e.g., Kelly et al. 2008). Thus, the total luminosity can be easily estimated through a (luminosity-dependent) bolometric correction, kBol. The situation is less clear for radio-loud AGNs, as the jet can potentially contribute to the X-ray emission. As shown earlier, in our case the quality of the Chandra spectrum is not high enough to show any evidence for a jet component, and the Chandra PSF at the position of the source is too large to disentangle a nuclear component from any kpc-scale extended emission. Thus, we simply multiply the measured X-ray luminosity by a bolometric correction to obtain the bolometric luminosity2. Duras et al. (2020) provide an analytical formula to compute kBol from LX. The significant intrinsic scatter of the relation (0.37 dex) has to be taken into account, together with the uncertainties over the parameters of the relation and those on the X-ray luminosity itself. To do this, we randomly draw the parameters of the correlation and of the X-ray luminosity assuming a Gaussian probability density function for each of them with a dispersion given by their uncertainties and we repeat this procedure 104 times to build a distribution of bolometric corrections keeping into account also the intrinsic scatter. This returns  . The final, X-ray derived bolometric luminosity is
  erg s−1.
4.2. From radio lobes
Following Ursini et al. (2018) and Bassani et al. (2021), we use the correlation reported by van Velzen et al. (2015) between the 1.4 GHz luminosity of the lobes and the bolometric luminosity of the AGN. The intrinsic scatter of the correlation is 0.47 dex, which is way larger than the uncertainty over the lobes luminosity at 1.4 GHz. Hence, the final lobes-derived bolometric luminosity is  erg s−1.
4.3. From the SED fitting
Another widely used method to estimate the bolometric luminosity and host stellar mass of an AGN is to perform a fit of its optical-infrared spectral energy distribution (SED) to disentangle the emission of the host galaxy from the emission of the AGN. We thus collected the available UV, optical, and IR photometry for J1430, for a total of 17 photometric data points (reported in Table 2), and fed them to the SED fitting package SED3FIT (Berta et al. 2013). SED3FIT is based on MAGPHYS (da Cunha et al. 2008) but includes an AGN template based on the models of Fritz et al. (2006) and Feltre et al. (2012). The median of 20 iterations, with its 1σ spread, is shown in Fig. 4. While the cold gas component has a large spread, the host galaxy and AGN contributions (above a few microns) are robustly fit. The stellar mass of the host galaxy is found to be  , and the bolometric luminosity of the AGN is
  erg s−1.
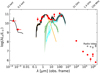 |
Fig. 4. Broadband SED of J1430 (red data points), covering ten orders of magnitude in wavelength. The leftmost points are the 2–7 keV and 0.5–2 keV fluxes from Chandra, respectively, as fitted by the best fit MYTorus model. The range of data points from ∼0.1−100 μ m have been fit with SED3FIT 20 times and the median fit is shown in black, with the colored strips labeling the 68% margins of the distributions for all the components. The host galaxy component of the fit is shown in orange, the AGN torus contribution is shown as green dashes and the star formation component is in cyan. The SED is typical of an obscured AGN, with the optical light dominated by the host galaxy. Based on the fit of this portion of the SED, we can infer both a reliable measure of the stellar mass of the host and the bolometric luminosity of the AGN. The rightmost data points show, in red, the core radio SED, while the gray points display the lobes emission. |
4.4. Bolometric luminosity and accretion rate
The different methods discussed above return fairly consistent results for the bolometric luminosity. In agreement with previous results for hard X-ray selected GRGs (e.g., Ursini et al. 2018), the X-ray-derived bolometric luminosity is larger than the results derived with other indicators. However, the significant intrinsic scatter of the relation used to obtain the X-ray bolometric correction makes the X-ray, radio, and SED-derived bolometric luminosities all statistically consistent with each other within 1σ. Even if the SED fitting returns a bolometric luminosity is significantly lower than the other estimates and this could be due to an underestimation of the absorption of the AGN emission; although it also provides a well-constrained host galaxy stellar mass, from which a black hole mass can be inferred using the well-known scaling relation between the stellar (bulge) and black hole masses (Häring & Rix 2004):  . Of course, we are implicitly assuming that the host galaxy is a spheroid; this assumption is justified, given its brightness and optical colors, typical of elliptical galaxies (Tempel et al. 2011) and that the majority of radio loud AGNs are hosted by massive, elliptical galaxies (e.g., Best et al. 2005). As a final note on luminosity, the poor signal to noise ratio (S/N) of the AGES optical spectrum of J1430 prevents us from gaining more insights into the AGN bolometric luminosity from the [OIII] emission line.
The Eddington ratio, which is often used as a proxy for the accretion rate onto the black hole, can be computed combining the previously derived bolometric luminosities with the black hole mass, as λEdd = LBol/1.26 × 1038(MBH/M⊙). Despite the derived Eddington ratios being highly uncertain, they all point to a source accreting at ∼1−10% of the Eddington luminosity. Once again, J1430 behaves like the other hard X-ray selected GRGs, which are powered by radiatively efficient accretion (Ursini et al. 2018), the only difference being the absence of convincing evidence of a recently restarted radio activity. Table 1 reports a summary of the properties of J1430 discussed thus far.
Collective information on the source.
Photometry used for the SED fitting.
5. Large-scale environment
The question of whether the environment around GRGs favours their exceptional growth is a question that is starting to be systematically explored, although no clear and definitive answer exists at the moment. Early on, it was suggested that GRGs may live in underdense regions, where the circumgalactic medium density is lower and the jets can expand more freely, resulting in a larger size (e.g., Mack et al. 1998). However, Dabhade et al. (2020a) suggested that a non-negligible fraction (∼10%) of LOFAR-detected GRGs reside in clusters. Also Tang et al. (2020) found increasing evidence that a sizeable fraction of GRGs could be associated with the brightest cluster galaxies, hence suggesting that underdense environments are not required to grow GRGs. On a similar note, Lan & Prochaska (2021) found no evidence that either the small- or large-scale environments around GRGs play any role in their growth.
To investigate the density of J1430’s nearby environment, we consider all I-band detected galaxies (down to a 5σ limiting AB magnitude of 26.0; Brown et al. 2007) within 15″ and 44″ (corresponding to ∼100 and ∼300 projected kpc at z = 0.629, respectively) from J1430 and with a photometric redshift within 0 < zphot < 1 (see Duncan et al. 2018a,b, for details on the photometric redshifts). Then, for each redshift satisfying the conditions, we assume a normal probability distribution with a standard deviation approximated by the width of the photo-z posterior (σ = (zmax − zmin)/2), and pick a random value. We repeat this procedure for 5000 times and build a normalized photometric redshift distribution. The same procedure is applied to a randomly chosen X-ray selected group in the Boötes field, at redshift within Δz = 0.1 from J1430’s redshift, namely XBS 41 at z = 0.543 (Vajgel et al. 2014), and to 50 randomly chosen galaxies in the same Boötes field with 0.629 < zphot < 0.631. As seen in Fig. 5, while the peak around the redshift of the group XBS 41 is more significant than the peak around J1430’s redshift, the 50 random galaxies show, on average, flat distributions of their projected companions. These results suggest that J1430 does not reside in an underdense environment.
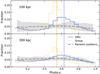 |
Fig. 5. Normalized photometric redshifts distribution, for galaxies with 0 < zphot < 1 and within ∼100 (top) and ∼300 (bottom) projected kpc from J1430 (blue histogram), for a z ∼ 0.54 X-ray selected group (Vajgel et al. 2014, XBS41; orange dotted histogram), and for 50 random galaxies in the Boötes field with 0.629 < zphot < 0.631 (grey dashed line with 68% spread). The distributions are drawn 5000 times each, taking into account the uncertainties over each photometric redshift as explained in the text. While the peak around the redshift of the GRG is less significant than the group at slightly lower redshift, the distributions of the 50 random positions demonstrate that J1430 does not reside in an underdense environment – and, instead, its environment may in fact be slightly overdense. |
6. Discussion
We investigated both the radio and X-ray properties of J1430, achieving results that are consistent with the bulk of the GRG population studies carried out thus far in the radio and hard X-ray band, and we demonstrated that its nucleus is actively accreting at moderate rate through a radiatively efficient accretion disk. Moreover, the bolometric luminosity derived from the X-ray spectrum is a factor of six larger than the one derived through the radio lobes – optical luminosity correlation. These results are consistent with what has been found for hard X-ray selected GRGs (Ursini et al. 2018; Bassani et al. 2021). An extensive multi-wavelength analysis allowed us to further check whether the radio core obeys the fundamental plane of black hole activity (Merloni et al. 2003), which relates the X-ray and core radio luminosity to the black hole mass. Considering the X-ray luminosity and the black hole mass inferred from the host stellar mass (derived from SED fitting), a core radio luminosity at 5 GHz of log(L5,pred/erg s−1) ∼ 40.3 was predicted, with the observed one being log(L5,obs/erg s−1) ∼ 40.5. This further supports the notion that the nuclear radio and X-ray activities are connected and still ongoing. Finally, we have shown that the large-scale environment of J1430 is not underdense with respect to other 50 random galaxies at the same redshift. All these pieces of evidence seem to suggest that J1430 is rather old and evolved, although with no clear sign of recent restarting of its nuclear activity, unlike what has been shown and found for hard X-ray selected GRGs with deep LOFAR imaging (e.g., Bruni et al. 2021). When compared with the whole GRG population of the SAGAN sample (Dabhade et al. 2020b), J1430 is among the highest redshift GRGs known to date, and the highest redshift GRG in the SAGAN sample with a radio spectral index between 150 MHz and 1.4 GHz α < −1. On the same line, it is a factor of 4.4 below the faintest GRG within the SAGAN sample at the same redshift. Its black hole mass (and conversely, its Eddington ratio) is also among the lowest (highest) of the whole population, but this is not surprising. Indeed, Dabhade et al. (2020b) estimated the black hole masses using the MBH − σ relation for a small subset of GRGs with an available measurement of the bulge velocity dispersion from SDSS optical spectra. As a consequence, the resulting black hole mass distribution is likely skewed to high masses and given that robustly measuring the bulge velocity dispersion is easier, the larger the black hole sphere of influence (and hence its mass) will be. On the other hand, both its radio power P1.4 GHz ∼ 9 × 1024 W Hz−1 and jet power, estimated following Dabhade et al. (2020b) as Qjet/1038 W = P150/3 × 1027 W Hz−1 ∼ 3.4 × 1043 erg s−1, are perfectly in line with the bulk of the SAGAN sample.
It is important to stress once again that the source presented in this paper has been serendipitously detected by visually inspecting the superposition of the LOFAR data and the Chandra CDWFS catalog. Medium or soft X-ray selected GRGs, such as the one investigated here, are expected to be more abundant than their hard X-ray selected counterparts: indeed, the hard X-ray selection probes at any redshift the high end of the luminosity function. J1430, with the extrapolated 14–195 keV and 20–100 keV luminosities of L14−195 ∼ 2.2 × 1044 erg s−1 and L20−100 ∼ 1.3 × 1044 erg s−1, would be a factor of ∼30 and ∼80 below the detection limits of Swift/BAT and INTEGRAL at z ∼ 0.6, respectively. Furthermore, GRGs are indeed likely much more abundant than generally believed at present4 (e.g., Delhaize et al. 2021), being the old tail of the population of radio galaxies. In addition, a large number of medium X-ray selected GRGs will make up an important control sample for testing whether the restarted scenario applies to lower luminosity GRGs as well and to comprehensively probe their duty cycle5.
7. Conclusions
In this paper, we report on the serendipitous discovery of a new Giant Radio Galaxy, J1430, which lies in the Boötes field at z = 0.629. Our conclusions are as follows:
-
Its radio properties are in line with the bulk of the GRG population, with the low-frequency spectrum dominated by the extended lobes and bright hotspots. There is no obvious indication that J1430 is a recently restarted GRG like most of the hard X-ray selected ones previously studied in the literature, both from the large-scale radio morphology and the core radio spectrum.
-
On the other hand, similarly to other hard X-ray selected GRGs, the nuclear source is bright in X-rays. The X-ray spectrum is moderately obscured, as expected for typical FRII radio galaxies. Furthermore, the nucleus of J1430 precisely sits on the fundamental plane of black hole activity. The accurate spectral analysis allows us to recover an accurate intrinsic X-ray luminosity. No robust detection of a jet component was obtained from the spectral analysis.
-
While we find, once again, that the X-ray-derived bolometric luminosity is larger than the bolometric luminosity derived from other methods, the uncertainties involved make them all broadly consistent with each other. Both the synchrotron cooling timescale and the position of the source in the P-D diagram suggest the GRG to be a few hundreds Myr old.
-
The number of galaxies around J1430 seems to favour a slightly overdense environment, further supporting recent findings that underdense environments are not required for growing GRGs.
-
Building a control sample of GRGs detected by soft X-ray observatories is crucial to probing the number density, redshift distribution, and restarting behavior displayed by hard X-ray selected GRGs and to fully investigate their duty cycle.
All our findings point toward J1430 being an aged FR II radio galaxy. Future work with ever-growing samples of GRGs selected at different frequencies will further elucidate whether there is a real physical difference between GRGs and smaller radio galaxies or whether they simply represent the final stage of their evolution (e.g., Lara et al. 2004).
We note that although the spectroscopic redshift of J1430 is not robust, it is fully consistent with the photometric redshift as derived by Duncan et al. (2018b), zphot = 0.56 ± 0.06.
As explained in Sect. 3.2, an excess-corrected bolometric luminosity can be estimated lowering the final result by ∼50%.
For the group analysis, we adjust the matching radii to 16″ and 47″, which translate to projected distances of ∼100 and ∼300 kpc, respectively.
Furthermore, the definition of GRGs based on projected size > 0.7 Mpc preferentially selects edge-on systems, missing the GRGs more aligned to our line of sight.
A control sample of hard X-ray selected, non-giant radio galaxies could provide powerful insight into the restarting view about GRGs as well.
Acknowledgments
We thank the anonymous referee for a very timely, thorough report that significantly improved the quality of the manuscript. It is also a pleasure to thank Gabriele Giovannini for fruitful conversations and useful suggestions. This research made use of LOFAR data products, which were provided by the LOFAR Surveys Key Science project (LSKSP; https://lofar-surveys.org/) and were derived from observations with the International LOFAR Telescope (ILT). LOFAR (van Haarlem et al. 2013) is the Low Frequency Array designed and constructed by ASTRON. It has observing, data processing, and data storage facilities in several countries, which are owned by various parties (each with their own funding sources), and which are collectively operated by the ILT foundation under a joint scientific policy. The efforts of the LSKSP have benefited from funding from the European Research Council, NOVA, NWO, CNRS-INSU, the SURF Co-operative, the UK Science and Technology Funding Council and the Jülich Supercomputing Centre. E.M. acknowledges financial support from the Czech Science Foundation project No.19-05599Y. This work was supported by the EU-ARC.CZ Large Research Infrastructure grant project LM2018106 of the Ministry of Education, Youth and Sports of the Czech Republic.
References
- Arnaud, K. A. 1996, in Astronomical Data Analysis Software and Systems V, eds. G. H. Jacoby, & J. Barnes, ASP Conf. Ser., 101, 17 [Google Scholar]
- Baloković, M., Brightman, M., Harrison, F. A., et al. 2018, ApJ, 854, 42 [Google Scholar]
- Bassani, L., Venturi, T., Molina, M., et al. 2016, MNRAS, 461, 3165 [Google Scholar]
- Bassani, L., Ursini, F., Malizia, A., et al. 2021, MNRAS, 500, 311 [Google Scholar]
- Belsole, E., Worrall, D. M., & Hardcastle, M. J. 2006, MNRAS, 366, 339 [NASA ADS] [Google Scholar]
- Berta, S., Lutz, D., Santini, P., et al. 2013, A&A, 551, A100 [NASA ADS] [CrossRef] [EDP Sciences] [Google Scholar]
- Best, P. N., Kauffmann, G., Heckman, T. M., et al. 2005, MNRAS, 362, 25 [NASA ADS] [CrossRef] [Google Scholar]
- Boorman, P. G., Gandhi, P., Alexander, D. M., et al. 2016, ApJ, 833, 245 [Google Scholar]
- Brown, M. J. I., Dey, A., Jannuzi, B. T., et al. 2007, ApJ, 654, 858 [NASA ADS] [CrossRef] [Google Scholar]
- Bruni, G., Panessa, F., Bassani, L., et al. 2020, MNRAS, 494, 902 [CrossRef] [Google Scholar]
- Bruni, G., Brienza, M., Panessa, F., et al. 2021, MNRAS, 503, 4681 [Google Scholar]
- Cash, W. 1979, ApJ, 228, 939 [NASA ADS] [CrossRef] [Google Scholar]
- Coppejans, R., Cseh, D., Williams, W. L., van Velzen, S., & Falcke, H. 2015, MNRAS, 450, 1477 [Google Scholar]
- Coppejans, R., Cseh, D., van Velzen, S., et al. 2016, MNRAS, 459, 2455 [CrossRef] [Google Scholar]
- Croston, J. H., Hardcastle, M. J., Mingo, B., et al. 2019, A&A, 622, A10 [NASA ADS] [CrossRef] [EDP Sciences] [Google Scholar]
- Dabhade, P., Röttgering, H. J. A., Bagchi, J., et al. 2020a, A&A, 635, A5 [NASA ADS] [CrossRef] [EDP Sciences] [Google Scholar]
- Dabhade, P., Mahato, M., Bagchi, J., et al. 2020b, A&A, 642, A153 [CrossRef] [EDP Sciences] [Google Scholar]
- da Cunha, E., Charlot, S., & Elbaz, D. 2008, MNRAS, 388, 1595 [Google Scholar]
- Delhaize, J., Heywood, I., Prescott, M., et al. 2021, MNRAS, 501, 3833 [Google Scholar]
- de Vries, W. H., Morganti, R., Röttgering, H. J. A., et al. 2002, AJ, 123, 1784 [NASA ADS] [CrossRef] [Google Scholar]
- Dey, A., Schlegel, D. J., Lang, D., et al. 2019, AJ, 157, 168 [NASA ADS] [CrossRef] [Google Scholar]
- Duncan, K. J., Brown, M. J. I., Williams, W. L., et al. 2018a, MNRAS, 473, 2655 [NASA ADS] [CrossRef] [Google Scholar]
- Duncan, K. J., Jarvis, M. J., Brown, M. J. I., & Röttgering, H. J. A. 2018b, MNRAS, 477, 5177 [Google Scholar]
- Duras, F., Bongiorno, A., Ricci, F., et al. 2020, A&A, 636, A73 [CrossRef] [EDP Sciences] [Google Scholar]
- Evans, D. A., Worrall, D. M., Hardcastle, M. J., Kraft, R. P., & Birkinshaw, M. 2006, ApJ, 642, 96 [Google Scholar]
- Fanaroff, B. L., & Riley, J. M. 1974, MNRAS, 167, 31 [NASA ADS] [CrossRef] [Google Scholar]
- Feltre, A., Hatziminaoglou, E., Fritz, J., & Franceschini, A. 2012, MNRAS, 426, 120 [Google Scholar]
- Fritz, J., Franceschini, A., & Hatziminaoglou, E. 2006, MNRAS, 366, 767 [Google Scholar]
- Fruscione, A., McDowell, J. C., Allen, G. E., et al. 2006, Proc. SPIE, 6270, 62701V [Google Scholar]
- Hardcastle, M. J. 2018, MNRAS, 475, 2768 [NASA ADS] [CrossRef] [Google Scholar]
- Häring, N., & Rix, H.-W. 2004, ApJ, 604, L89 [Google Scholar]
- Jannuzi, B. T., & Dey, A. 1999, in The NOAO Deep Wide-Field Survey, eds. R. Weymann, L. Storrie-Lombardi, M. Sawicki, & R. Brunner, ASP Conf. Ser., 191, 111 [Google Scholar]
- Kalberla, P. M. W., Burton, W. B., Hartmann, D., et al. 2005, A&A, 440, 775 [NASA ADS] [CrossRef] [EDP Sciences] [Google Scholar]
- Kelly, B. C., Bechtold, J., Trump, J. R., Vestergaard, M., & Siemiginowska, A. 2008, ApJS, 176, 355 [Google Scholar]
- Kenter, A., Murray, S. S., Forman, W. R., et al. 2005, ApJS, 161, 9 [NASA ADS] [CrossRef] [Google Scholar]
- Kochanek, C. S., Eisenstein, D. J., Cool, R. J., et al. 2012, ApJS, 200, 8 [NASA ADS] [CrossRef] [Google Scholar]
- Lan, T.-W., & Prochaska, J. X. 2021, MNRAS, 502, 5104 [Google Scholar]
- Lara, L., Giovannini, G., Cotton, W. D., et al. 2004, A&A, 421, 899 [NASA ADS] [CrossRef] [EDP Sciences] [Google Scholar]
- Mack, K. H., Klein, U., O’Dea, C. P., Willis, A. G., & Saripalli, L. 1998, A&A, 329, 431 [NASA ADS] [Google Scholar]
- Magdziarz, P., & Zdziarski, A. A. 1995, MNRAS, 273, 837 [NASA ADS] [CrossRef] [Google Scholar]
- Masini, A., Comastri, A., Hickox, R. C., et al. 2019, ApJ, 882, 83 [Google Scholar]
- Masini, A., Hickox, R. C., Carroll, C. M., et al. 2020, ApJS, 251, 2 [Google Scholar]
- Massaro, F., Capetti, A., Paggi, A., et al. 2020, ApJS, 247, 71 [Google Scholar]
- Merloni, A., Heinz, S., & di Matteo, T. 2003, MNRAS, 345, 1057 [NASA ADS] [CrossRef] [Google Scholar]
- Miller, B. P., Brandt, W. N., Schneider, D. P., et al. 2011, ApJ, 726, 20 [Google Scholar]
- Moravec, E., Gonzalez, A. H., Stern, D., et al. 2020, ApJ, 888, 74 [Google Scholar]
- Muchovej, S., Leitch, E., Carlstrom, J. E., et al. 2010, ApJ, 716, 521 [Google Scholar]
- Murphy, K. D., & Yaqoob, T. 2009, MNRAS, 397, 1549 [NASA ADS] [CrossRef] [Google Scholar]
- Murray, S. S., Kenter, A., Forman, W. R., et al. 2005, ApJS, 161, 1 [NASA ADS] [CrossRef] [Google Scholar]
- Retana-Montenegro, E., Röttgering, H. J. A., Shimwell, T. W., et al. 2018, A&A, 620, A74 [NASA ADS] [CrossRef] [EDP Sciences] [Google Scholar]
- Ricci, C., Trakhtenbrot, B., Koss, M. J., et al. 2017, ApJS, 233, 17 [NASA ADS] [CrossRef] [Google Scholar]
- Shimwell, T. W., Röttgering, H. J. A., Best, P. N., et al. 2017, A&A, 598, A104 [NASA ADS] [CrossRef] [EDP Sciences] [Google Scholar]
- Tang, H., Scaife, A. M. M., Wong, O. I., et al. 2020, MNRAS, 499, 68 [Google Scholar]
- Tasse, C., Shimwell, T., Hardcastle, M. J., et al. 2021, A&A, 648, A1 [EDP Sciences] [Google Scholar]
- Tempel, E., Saar, E., Liivamägi, L. J., et al. 2011, A&A, 529, A53 [NASA ADS] [CrossRef] [EDP Sciences] [Google Scholar]
- Terashima, Y., & Wilson, A. S. 2003, ApJ, 583, 145 [Google Scholar]
- Ursini, F., Bassani, L., Panessa, F., et al. 2018, MNRAS, 481, 4250 [Google Scholar]
- Vajgel, B., Jones, C., Lopes, P. A. A., et al. 2014, ApJ, 794, 88 [Google Scholar]
- van Haarlem, M. P., Wise, M. W., Gunst, A. W., et al. 2013, A&A, 556, A2 [NASA ADS] [CrossRef] [EDP Sciences] [Google Scholar]
- van Velzen, S., Falcke, H., & Körding, E. 2015, MNRAS, 446, 2985 [Google Scholar]
- Williams, W. L., Intema, H. T., & Röttgering, H. J. A. 2013, A&A, 549, A55 [NASA ADS] [CrossRef] [EDP Sciences] [Google Scholar]
- Williams, W. L., van Weeren, R. J., Röttgering, H. J. A., et al. 2016, MNRAS, 460, 2385 [NASA ADS] [CrossRef] [Google Scholar]
- Willis, A. G., Strom, R. G., & Wilson, A. S. 1974, Nature, 250, 625 [Google Scholar]
All Tables
All Figures
|
Fig. 1. Multi-wavelength images of the GRG. Top left: LOFAR 150 MHz (Tasse et al. 2021) cutout of the GRG, where the white ellipse labels the beam size of the instrument. The inset shows the optical composite grz DECaLS (Dey et al. 2019) DR8 image, with the white circle marking 100 projected kpc from the galaxy. Top right: Chandra 0.5–7 keV (Masini et al. 2020) cutout of the GRG, spatially rebinned with a 4 × 4 pixel scale, with the white LOFAR contours overlaid. The X-ray image demonstrates that the core is clearly detected, unlike the lobes and hotspots. The inset shows a zoom-in on the core, with a native Chandra pixel scale. The dashed white circle in the inset labels the PSF size encircling ∼90% of the counts. Hence, the X-ray emission is consistent with being point-like. Bottom row: radio cutouts. In all the images, the white ellipses label the beam size of the instrument. From left to right: GMRT 150 MHz (Williams et al. 2013), VLA 325 MHz (Coppejans et al. 2015), GMRT 608 MHz (Coppejans et al. 2016), WSRT 1.4 GHz (de Vries et al. 2002). While all three components (core and lobes or hotspots) are detected at 608 MHz and 1.4 GHz, only the lobes are detected by GMRT at 150 MHz and the whole GRG is undetected by VLA at 325 MHz. |
| In the text | |
|
Fig. 2. Radio spectrum of the GRG, with flux densities measured at LOFAR 150 MHz (Tasse et al. 2021), VLA 325 MHz (Coppejans et al. 2015), GMRT 608 MHz (Coppejans et al. 2016), WSRT 1.4 GHz (de Vries et al. 2002), VLA 5 GHz (Muchovej et al. 2010), and SZA 31 GHz (Muchovej et al. 2010). The green filled circles mark the core data up to 1.4 GHz (the VLA 325 MHz data point being a 3σ upper limit), while the blue diamonds and red squares refer to the southern and northern lobes, respectively, and have been slightly shifted in frequency to improve the clarity of the plot. The black stars label the total emission from the three components, fit by a power law of slope ∼ − 1 (black dashed line). At higher frequencies (gray circles), the emission is likely dominated by the core, which shows a flat spectrum across the whole range of frequencies. |
| In the text | |
|
Fig. 3. Unfolded spectrum of J1430 with the best-fit MYTorus model. The solid black line marks the total model, the dashed components are the transmitted and line components of the MYTorus model, while the dot-dashed line labels the soft scattered power law. The curvature of the spectrum below ∼5 keV implies moderate obscuration. |
| In the text | |
|
Fig. 4. Broadband SED of J1430 (red data points), covering ten orders of magnitude in wavelength. The leftmost points are the 2–7 keV and 0.5–2 keV fluxes from Chandra, respectively, as fitted by the best fit MYTorus model. The range of data points from ∼0.1−100 μ m have been fit with SED3FIT 20 times and the median fit is shown in black, with the colored strips labeling the 68% margins of the distributions for all the components. The host galaxy component of the fit is shown in orange, the AGN torus contribution is shown as green dashes and the star formation component is in cyan. The SED is typical of an obscured AGN, with the optical light dominated by the host galaxy. Based on the fit of this portion of the SED, we can infer both a reliable measure of the stellar mass of the host and the bolometric luminosity of the AGN. The rightmost data points show, in red, the core radio SED, while the gray points display the lobes emission. |
| In the text | |
|
Fig. 5. Normalized photometric redshifts distribution, for galaxies with 0 < zphot < 1 and within ∼100 (top) and ∼300 (bottom) projected kpc from J1430 (blue histogram), for a z ∼ 0.54 X-ray selected group (Vajgel et al. 2014, XBS41; orange dotted histogram), and for 50 random galaxies in the Boötes field with 0.629 < zphot < 0.631 (grey dashed line with 68% spread). The distributions are drawn 5000 times each, taking into account the uncertainties over each photometric redshift as explained in the text. While the peak around the redshift of the GRG is less significant than the group at slightly lower redshift, the distributions of the 50 random positions demonstrate that J1430 does not reside in an underdense environment – and, instead, its environment may in fact be slightly overdense. |
| In the text | |
Current usage metrics show cumulative count of Article Views (full-text article views including HTML views, PDF and ePub downloads, according to the available data) and Abstracts Views on Vision4Press platform.
Data correspond to usage on the plateform after 2015. The current usage metrics is available 48-96 hours after online publication and is updated daily on week days.
Initial download of the metrics may take a while.