Fig. 1.
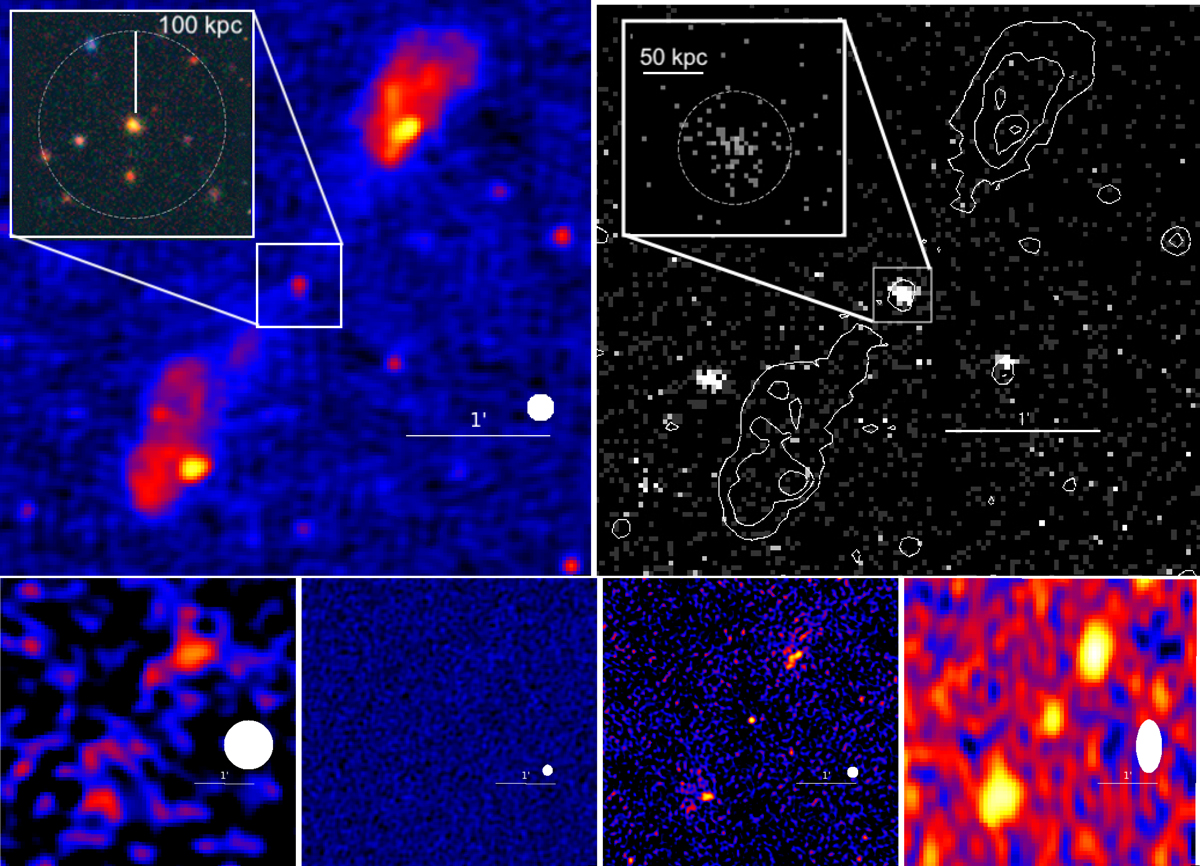
Multi-wavelength images of the GRG. Top left: LOFAR 150 MHz (Tasse et al. 2021) cutout of the GRG, where the white ellipse labels the beam size of the instrument. The inset shows the optical composite grz DECaLS (Dey et al. 2019) DR8 image, with the white circle marking 100 projected kpc from the galaxy. Top right: Chandra 0.5–7 keV (Masini et al. 2020) cutout of the GRG, spatially rebinned with a 4 × 4 pixel scale, with the white LOFAR contours overlaid. The X-ray image demonstrates that the core is clearly detected, unlike the lobes and hotspots. The inset shows a zoom-in on the core, with a native Chandra pixel scale. The dashed white circle in the inset labels the PSF size encircling ∼90% of the counts. Hence, the X-ray emission is consistent with being point-like. Bottom row: radio cutouts. In all the images, the white ellipses label the beam size of the instrument. From left to right: GMRT 150 MHz (Williams et al. 2013), VLA 325 MHz (Coppejans et al. 2015), GMRT 608 MHz (Coppejans et al. 2016), WSRT 1.4 GHz (de Vries et al. 2002). While all three components (core and lobes or hotspots) are detected at 608 MHz and 1.4 GHz, only the lobes are detected by GMRT at 150 MHz and the whole GRG is undetected by VLA at 325 MHz.
Current usage metrics show cumulative count of Article Views (full-text article views including HTML views, PDF and ePub downloads, according to the available data) and Abstracts Views on Vision4Press platform.
Data correspond to usage on the plateform after 2015. The current usage metrics is available 48-96 hours after online publication and is updated daily on week days.
Initial download of the metrics may take a while.