Fig. 2.
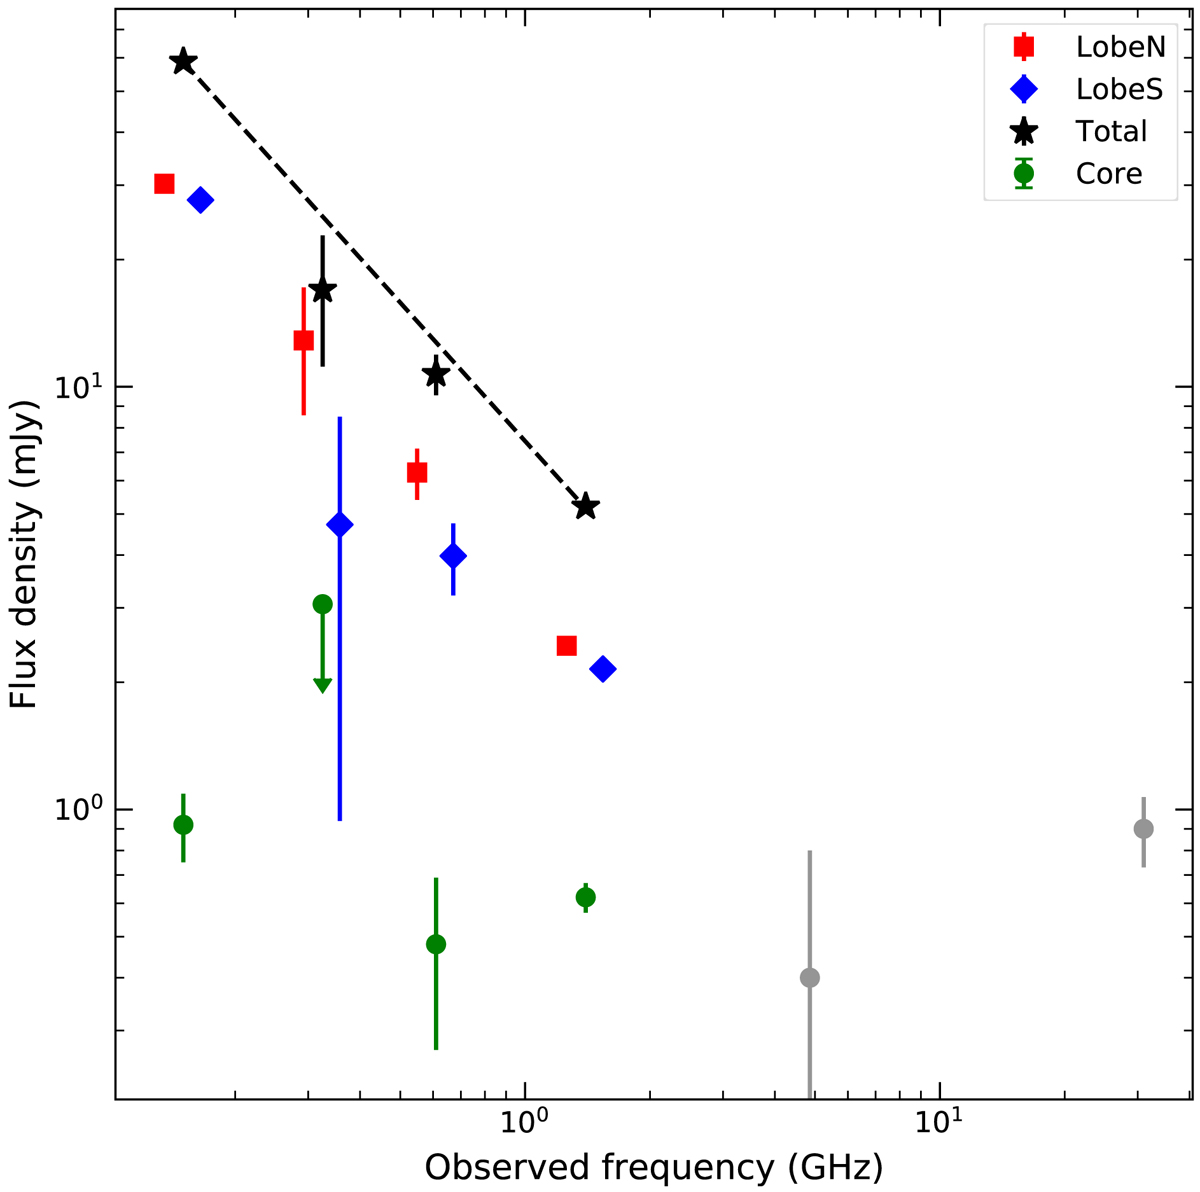
Radio spectrum of the GRG, with flux densities measured at LOFAR 150 MHz (Tasse et al. 2021), VLA 325 MHz (Coppejans et al. 2015), GMRT 608 MHz (Coppejans et al. 2016), WSRT 1.4 GHz (de Vries et al. 2002), VLA 5 GHz (Muchovej et al. 2010), and SZA 31 GHz (Muchovej et al. 2010). The green filled circles mark the core data up to 1.4 GHz (the VLA 325 MHz data point being a 3σ upper limit), while the blue diamonds and red squares refer to the southern and northern lobes, respectively, and have been slightly shifted in frequency to improve the clarity of the plot. The black stars label the total emission from the three components, fit by a power law of slope ∼ − 1 (black dashed line). At higher frequencies (gray circles), the emission is likely dominated by the core, which shows a flat spectrum across the whole range of frequencies.
Current usage metrics show cumulative count of Article Views (full-text article views including HTML views, PDF and ePub downloads, according to the available data) and Abstracts Views on Vision4Press platform.
Data correspond to usage on the plateform after 2015. The current usage metrics is available 48-96 hours after online publication and is updated daily on week days.
Initial download of the metrics may take a while.