| Issue |
A&A
Volume 648, April 2021
|
|
|---|---|---|
| Article Number | A87 | |
| Number of page(s) | 13 | |
| Section | Interstellar and circumstellar matter | |
| DOI | https://doi.org/10.1051/0004-6361/202040033 | |
| Published online | 15 April 2021 | |
Self-scattering on large, porous grains in protoplanetary disks with dust settling
Institut für Theoretische Physik und Astrophysik, Christian-Albrechts-Universität zu Kiel,
Leibnizstr. 15,
24118
Kiel, Germany
e-mail: rbrunngraeber@astrophysik.uni-kiel.de
Received:
1
December
2020
Accepted:
26
February
2021
Context. Observations of protoplanetary disks in the sub-millimetre wavelength range suggest that polarisation is caused by scattering of thermal re-emission radiation. Most of the dust models that are used to explain these observations have major drawbacks: they either use much smaller grain sizes than expected from dust evolution models, or result in polarisation degrees that are lower than observed.
Aims. We investigate the effect of dust grain porosity on the observable polarisation due to scattering at sub-millimetre wavelengths arising from grain size distributions up to millimetre sizes, as they are expected to be present close to the midplane of protoplanetary disks.
Methods. Using the effective medium theory, we calculated the optical properties of porous dust and used them to predict the behaviour of the observable polarisation degree due to scattering. Subsequently, Monte Carlo radiative transfer simulations for protoplanetary disks with porous dust grains were performed to analyse the additional effect of the optical depth structure, and thus the effect of multiple scattering events and inhomogeneous temperature distributions on the net observable polarisation degree.
Results. We find that porous dust grains with moderate filling factors of about 10% increase the degree of polarisation compared to compact grains. For higher grain porosities, that is, grains with a filling factor of 1% or lower, the extinction opacity decreases, as does the optical depth of a disk with constant mass. Consequently, the unpolarised direct radiation dominates the scattered flux, and the degree of polarisation drops rapidly. Even though the simulated polarisation degree is higher than in the case of compact grains, it is still below the typical observed values for face-on disks. However, the polarisation degree can be increased when crucial model assumptions derived from disk and dust evolution theories, for instance, dust settling and millimetre-sized dust grains, are dropped. In the case of inclined disks, however, our reference model is able to achieve polarisation degrees of about 1%, and using higher disk masses, even higher than this.
Key words: radiative transfer / polarization / protoplanetary disks / scattering / radiation mechanisms: thermal
© ESO 2021
1 Introduction
Observations of the polarised continuum radiation of protoplanetary disks in the (sub-)millimetre (mm) wavelength range are considered an important source of information about the structure of magnetic fields and the dust grain shape and size in these disks. In this context, two main polarisation mechanisms are important: dichroic emission and absorption by magnetically aligned non-spherical grains, and polarisation due to scattering. Especially the so-called self-scattering mechanism, that is, scattering of thermal re-emission radiation by large dust grains at (sub-)mm wavelengths, provides a promising explanation for many polarisation patterns that have recently been observed in protoplanetary disks (e.g. Harris et al. 2018; Lee et al. 2018; Mori et al. 2019; Ohashi & Kataoka 2019; Sadavoy et al. 2019). The local polarisation degree in these spatially resolved maps has been found to be typically about 1–3%, with some rare outliers in both directions, for example, HD 142527, VLA 1623, or AS 209 (Kataoka et al. 2016; Harris et al. 2018; Mori et al. 2019). To reproduce this relatively high value, it is often stated that dust grains with radii of about 100 μm contribute most to the observed flux (Bacciotti et al. 2018; Hull et al. 2018; Lin et al. 2020; Ohashi et al. 2020). However, this explanation appears to contradict commonly accepted scenarios of grain growth in protoplanetary disks. There, grains are expected to grow rather fast to about mm sizes and eventually dominate the emission in this wavelength regime (e.g. Beckwith & Sargent 1991; Testi et al. 2014). Recent radiative transfer simulations allowing such large grains, however, predict lower polarisation degrees than observed (Brunngräber & Wolf 2020; Yang & Li 2020). Furthermore, due to size-dependent turbulent vertical mixing, larger grains will settle towards the midplane, which leads to even lower polarisation degrees (Brunngräber & Wolf 2020). This significant discrepancy in the degree of polarisation between simulation and observation is a major drawback in the explanation of the observed polarisation with scattering.
To overcome this lack of polarisation in simulations, more complex dust models have been proposed, such as oblate, prolate, or fractal grain shapes, or different chemical compositions (Kirchschlager & Bertrang 2020; Brunngräber & Wolf 2020; Yang & Li 2020). In the quoted studies, the polarisation after single scattering of an initially unpolarised wave is usually discussed, that is, the ratio of the Müller matrix elements S12∕S11 and the albedo ω. However, these studies lack full radiative transfer simulations to prove the applicability of these results in the environment of protoplanetary disks, for instance. The effects of multi-scattering, attenuation of the radiation, and the contribution of unpolarised re-emission radiation are likely to change the degree of polarisation drastically.
A particularly frequently proposed solution for the discrepancy of the degree of polarisation is the use of porous dust grains because the polarisation after single scattering increases with increasing porosity (e.g. Tazaki et al. 2019; Brunngräber & Wolf 2020). Theoretical and laboratory studies of dust growth and evolution both suggest low filling factors Φ, that is, highly porous grains, and/or fractal geometries (Blum et al. 2000; Blum & Wurm 2008; Kothe et al. 2013; Garcia & Gonzalez 2020). Furthermore, dust particles collected in the Solar System and the upper layers of the Earth’s atmosphere show a fractal and/or porous structure as well (Brownlee et al. 1977; A’Hearn et al. 2005; Abe et al. 2006; Westphal et al. 2014). In this paper, we examine the effect of dust grain porosity on the polarised fraction of scattered radiation at sub-mm wavelengths of protoplanetary disks. Therefore we focus at first on the optical properties that determine the level of polarised scattered radiation in Sect. 2. This approach is commonly used because it isindependent of any underlying density distribution and thus requires no elaborate radiative transfer simulations. At the same time, it allows a straightforward examination of a broad parameter space. The dust model is given by a grain size distribution composed of porous dust, and the effect of different filling factors and maximum grain sizes is investigated. This dust model is described in Sect. 2.1, and the results are presented in Sect. 2.2 and discussed in Sect. 2.3. In the second part of this paper, in Sect. 3, radiative transfer simulations are performed in the context of a protoplanetary disk where the largest grains have settled towards the midplane. For this purpose, we introduce the underlying disk model in Sect. 3.1, and present the results of the Monte Carlo simulations in Sect. 3.2. The discussion of these results is provided in Sect. 4, and we summarize the entire paper in Sect. 5.
2 Porosity and the general effect on polarised scattered radiation
As a first step to investigate the effect of grain porosity on the degree of polarisation due to scattering, we examine selected optical quantities of the dust. This procedure is independent of any spatial density distribution, therefore it is universal and only depends on the intrinsic attributes of the dust grains determining its optical properties, such as chemical composition, shape, internal structure, and refractive index. This approach is therefore also applied in many studies concerning scattering at (sub-)mm wavelengths to explore the parameter space of dust composition and maximum grain size in the size distribution with regard to the expected degree of polarisation (e.g. Kataoka et al. 2015; Tazaki et al. 2019; Yang & Li 2020; Kirchschlager & Bertrang 2020; Brunngräber & Wolf 2020).
2.1 Dust model
Owing to growth and destruction processes in protoplanetary disks, dust grains are expected to have sizes that range over many orders of magnitude. Each grain size has a different wavelength-dependent absorption, emission, and scattering behaviour. To account for this, we integrated these quantities weighted by the size-dependent abundance over the entire grain size distribution, which was adopted to be a power law with n(s) ∝ sq as found for the interstellar medium (Mathis et al. 1977), with s being the radius of a spherical grain. If not stated otherwise, the size exponent q was set to −3.5. The lower boundary of the size distribution is smin = 5 nm and the upper boundary smax is a free parameter.
The dust model was chosen to consist only of spherical grains. For the chemical composition, we used the refractive indices of astronomical silicate (astrosil) and the two main orientations of graphite (parallel and perpendicular, Draine & Malhotra 1993) from Draine (2003). To mimic porous dust grains in our study, we considered spherical grains with different filling factors Φ and explored their effect on the scattering polarisation. The filling factor is defined as the ratio of the volume of the dust material Vdust to the total grain volume Vtotal,
 (1)
(1)
with the porosity  , with
  , that is, a filling factor of Φ = 1 represents compact grains.
The complex refractive indices of these porous grains were approximated using the effective medium theory (EMT) and the Bruggeman mixing rule (Bruggeman 1935). The optical quantities, that is, cross-sections of absorption and scattering Cabs and Csca, and the elements of the Müller matrix  , were calculated with the approximation solution of the Mie theory (Mie 1908) using the tool miex (Wolf & Voshchinnikov 2004). These properties were calculated for grain size distributions with 101 logarithmically spaced different maximum grain sizes smax between 1 μm and 10 cm, and for 101 logarithmically spaced different filling factors between 10−4 and 1. Each of these 10 201 calculations used 100 grain size bins between smin = 5 nm and smax to average the optical quantities over the size distribution (Wolf & Voshchinnikov 2004, their Eqs. (28)–(30)), and 361 scattering angles in the range [0°, 180°].
2.2 Optical quantities
In this section, we restrict the discussion to astrosil because it is the most abundant component in protoplanetary disks. However, our general qualitative conclusions with respect to the effect of porosity on the polarisation characteristics are also applicable for the case of graphite; see Appendix A for the corresponding plots for graphite.
Single scattering
First, we assumed an unpolarised wave, which is scattered exactly once by a spherical dust grain. In this simple case, the polarisation degree of the outgoing wave is only a function of the two Müller matrix elements S11 and S12 of the dust,

We refer to p as the single scattering polarisation. It is the most commonly used quantity to describe and predict the scattering polarisation of different dust grains (e.g. Kataoka et al. 2015; Tazaki et al. 2019; Yang & Li 2020; Kirchschlager & Bertrang 2020; Brunngräber & Wolf 2020). For spherical grains, the thermal re-emission of the dust is unpolarised and the highest contribution to the net, that is, observable, polarised flux is indeed given by single-scattering events. Hence, the quantity p is a good qualitative indicator for the expected net polarisation degree. The Müller matrix elements and thus p depend on the scattering angle θ. The predominant scattering angle is a function of the actual geometrical set-up and wavelength λ.
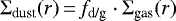
For the Rayleigh scattering regime (2πs ≪ λ), the single-scattering polarisation is maximised for a scattering angle of θ = 90 °. For larger grains (or smaller wavelengths), the single-scattering polarisation p shows a fast-changing wavy pattern for different scattering angles (Brunngräber & Wolf 2019). We therefore focused on a scattering angle of θ = 90 °. In addition, scattering angles close to this value also dominate the radiation of face-on protoplanetary disks, as shown in Sect. 3. The corresponding single-scattering polarisation p is shown in the upperleft panel of Fig. 1 for grain size distributions with different maximum grain sizes between 1 μm and 10 cm and filling factors between 10−4 and 1 at a wavelength of λ = 850 μm. We restrict the discussion here to this wavelength, which is close to the wavelength of many of the polarisation observations performed with ALMA (e.g., Stephens et al. 2017; Hull et al. 2018; Lee et al. 2018; Dent et al. 2019; Lin et al. 2020). Almost the entire parameter space yields a single-scattering polarisation of unity. The polarisation is thus determined by Rayleigh scattering although the grain sizes are partially much larger than the wavelength. Only for high filling factors (low porosities) is the degree of polarisation lower as a result of Mie scattering.
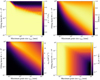 |
Fig. 1 Degree of polarisation for single scattering p = −S12∕S11 for a scattering angle of θ = 90° (upper left), albedo ω (upper right), extinction opacity (lower left), and probability density function Ŝ11 for the scattering angle θ = 90° (lower right). All quantities are calculated for a grain size distribution with q = −3.5, smin = 5 nm and different upper grain size limits smax at a wavelength of 850 μm for astrosil. |
Scattering probability
However, in contrast to the above simplistic scenario, the total flux does not only include the scattered radiation, but also the direct thermal emission of dust, that is, unscattered radiation. As this direct emission is unpolarised according to our dust model, the net polarisation degree is lower than the polarisation degree resulting from scattering alone. In order to derive a useful measure for the total net polarisation degree under these more complex circumstances, we have to quantify whether a photon interacts with dust grains (scattering or absorption) on its path to the observer. Depending on the optical depth τ ∝ κext ⋅ ρdust along that path, the probability of interaction is given by 1 − exp(−τ) with the extinction opacity κext = Cext∕mdust, the extinction cross-sectionCext = Csca + Cabs, the mean grain mass mdust, and the spatial dust mass density ρdust. If the observed density distribution is optically thin (τ ≪ 1), the observable flux is determined by unpolarised direct thermal re-emission radiation. For a given optical depth, the ratio of scattered radiation to direct thermal radiation is also determined by the fraction of scattering events among all interactions. Consequently, the polarisation degree of the emerging radiation is given by both the optical depth and the albedo ω,
The albedo and extinction opacity, which determines the optical depth, are shown in the upper right and lower left panel of Fig. 1, respectively. For large maximum grain sizes, the opacity first increases with decreasing filling factor and decreases again after reaching a maximum value. Whereas the grain mass is proportional to the filling factor, the extinction cross-section shows a more complex behaviour. At first, it decreases much slower with decreasing filling factor than the grain mass. However, for filling factors Φ ≲ 10−2, the cross-section is roughly proportional to Φ2 and thus decreases faster than the grain mass. Hence, the opacity is maximised at the transition of these two regions. In addition, the opacity is constant for a constant product smax ⋅ Φ, which has been shown previously by Kataoka et al. (2014) and Tazaki et al. (2019), for example.
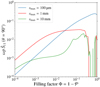 |
Fig. 2 Product of albedo ω, single-scattering polarisation p, and probability density function Ŝ11 for the scattering angle θ = 90°. All quantities are calculated for a grain size distribution with q = −3.5, smin = 5 nm and three different maximum grain sizes smax = 100 μm (blue), 1 mm (red), and 10 mm (green) at a wavelength of 850 μm for astrosil; see Sect. 2.3 for the corresponding discussion. |
Scattering angle dependency
If a scattering event occurs, the actual intensity of the radiation scattered in the direction of the observer is also a function of the scattering angle θ. For single scattering, this dependency is given by the first Müller matrix element S11 (θ). The probability density function  for a scattering angle of θ = 90° is shown in the lower right panel of Fig. 1. For large maximum grain sizes, this probability decreases for increasing grain size because large grains tend to scatter predominantly in the forward direction, that is, θ ≈ 0°. With increasing grain size, the intensity of the radiation that is scattered at 90 ° decreases. As a consequence, the flux ratio of scattered to direct radiation and hence the degree of polarisation decreases as well.
2.3 Conclusion
To evaluate the effect of the grain porosity of the observable polarisation, a combined analysis of all of the aforementioned quantities is mandatory. Lower filling factors increase the single-scattering polarisation p and the albedo ω. At the same time, however, the extinction opacity, and thus the scattering probability, decreases as well as the probability Ŝ11 for the scattering angle θ = 90°. In Fig. 2, the product of albedo, single-scattering polarisation, and the scattering probability density function for θ = 90 ° as a function of the filling factor Φ is shown for different maximum grain sizes smax. This product can be used as an advanced proxy for the polarisation degree due to scattering for optically thick environments. For grains in the Rayleigh scattering regime, a decrease in filling factor Φ decreases this proxy and therefore the expected polarisation degree. For size distributions with large maximum grain sizes compared to the wavelength and high filling factors, the usual wavy pattern of the Mie scattering regime is present, which also decreases this quantity. Thus, for the combination of sub-mm wavelengths and large grain sizes, the degree of polarisation is expected to first increase with decreasing filling factor and after reaching a maximum value, to decrease again for even lower filling factors.
In summary, the analysis of these optical quantities derived from the complex refractive index already provides useful results in the context of polarisation due to (sub-)mm scattering off porous dust grains. First, increasing the porosity, that is, decreasing the filling factor, results in a higher single-scattering polarisation p of up to 100%. In addition, the albedo increases up to unity as well. Thus, the quantity p ⋅ ω, which is occasionally used in the literature as a simple proxy for expected polarisation degrees (e.g. Kataoka et al. 2015; Tazaki et al. 2019; Yang & Li 2020), is maximised.
Second, highly porous grains tend to scatter almost exclusively in the forward direction. For the considered spherical grains, forward scattering does not produce polarised radiation. This reduces the scattering probability and polarised flux for larger scattering angles.
Third, above a certain threshold of the maximum grain size of about 0.3 mm for the size distribution, composition, and wavelength considered in Fig. 1, the extinction opacity first increases with increasing filling factors but decreases after reaching a maximum value. For filling factors below this maximum, the opacity drops rather fast and the optical depth decreases. This reduces the ratio of scattered to direct radiation and ultimately, the degree of polarisation. In addition, the opacity is roughly constant for a constant product smax ⋅ Φ.
And lastly, considering the single-scattering polarisation p alone is in general not sufficient to predict the net polarisation nor its qualitative behaviour, that is, trends as a function of grain properties. Three more quantities result from the refractive index of the dust and contribute significantly to the polarisation degree: albedo, extinction opacity, and the fraction of radiation scattered in the direction of the observer.
3 Radiative transfer simulations of a protoplanetary disk
In order to evaluate the effect of dust grain porosity on the scattering polarisation in the sub-mm wavelength regime in the environmentof protoplanetary disks, comprehensive numerical simulations are mandatory to account for the complex processes that determine the observable polarisation. Therefore full 3D Monte Carlo radiative transfer simulations with the publicly available1 software POLARIS (Reissl et al. 2016) were conducted. In addition to the optical properties that were used in the simple approach in Sect. 2, these simulations also considered self-consistent dust temperature for each grain size bin, the contributionof unpolarised direct re-emission, multiple scattering, local radiation field anisotropy, the scattering angle as a function of spatial density distribution and viewing angle, and a size-dependent vertical density distribution resulting from dust settling. Forthis purpose, we first define the density distribution of our protoplanetary disk model including dust settling in Sect. 3.1. In Sect. 3.2, the results of the radiative transfer simulations are discussed.
3.1 Model set-up
For high polarisation due to scattering, a high optical depth is necessary. Therefore self-scattering in the mm wavelength regime is almost exclusively observed in protoplanetary disks. In these disks, grain sizes from a few nanometres up to centimetres are expected to exist (e.g. Beckwith & Sargent 1991; Testi et al. 2014). Due to gas drag, the larger grains settle towards the midplane of the disk, whereas the smallest grains are coupled to the gas and thus show a much larger vertical extent (Safronov 1972; Goldreich & Ward 1973; Dubrulle et al. 1995; Dullemond & Dominik 2004; Woitke et al. 2016). The radial and vertical density distribution of the dust is therefore a function of the grain size (Gräfe et al. 2013; Pinte et al. 2016; Guilloteau et al. 2016; Avenhaus et al. 2018; Andrews et al. 2018; Villenave et al. 2020). Additionally, the scattering and polarisation efficiency also depend on grain size. To account for these effects, the radiative transfer simulations in this study were performed on the basis of a protoplanetary disk model where the largest grains have already settled towards the midplane. A more detailed description of the disk model can be found in Brunngräber & Wolf (2020). The gas density distribution ρgas is given by (Lynden-Bell & Pringle 1974; Kenyon & Hartmann 1995; Hartmann et al. 1998)
![\begin{equation*} \rho_{\text{gas}}(r,z)\,{=}\, \frac{\Sigma_{\text{gas}}(r)}{\sqrt{2\pi}\,h_{\text{gas}}(r)}\!\cdot\exp{\left[-\frac{1}{2}\left(\frac{z}{h_{\text{gas}}(r)}\right)^2\right]}\, \end{equation*}](/articles/aa/full_html/2021/04/aa40033-20/aa40033-20-eq9.png)
with the vertically integrated surface density
![\begin{equation*}\Sigma_{\text{gas}}(r)\,{=}\, \sqrt{2\pi}\,\rho_0\,{h_{\text{ref}}}\cdot\left(\frac{r}{R_0}\right)^{-\gamma}\cdot\exp{\left[-\left(\frac{r}{R_{\text{trunc}}}\right)^{2-\gamma}\right]} \end{equation*}](/articles/aa/full_html/2021/04/aa40033-20/aa40033-20-eq10.png) (2)
(2)
with (r, z) being the usual cylindrical coordinates, R0 is the radius where the gas scale height hgas reaches the reference scale height href, Rtrunc is the truncation radius, and ρ0 is the density scaling parameter that defines the total gas mass.
To account for the dust settling, the dust mass was re-distributed vertically. The dust scale height hdust(r, s, Φ) was downscaled according to the settling model of Dubrulle et al. (1995) and Woitke et al. (2016) for grains with radius s and bulk density ρbulk,
 (3)
(3)
where the settling function f(r, s, Φ) is given by
 (4)
(4)
The parameter αsettle regulates the strength of the settling and is determined by the disk viscosity and the strength of turbulent mixing (Dubrulle et al. 1995; Woitke et al. 2016). We wish to emphasise that due to the dependency on  the strength of the vertical settling is thus a function of porosity and is weaker for highly porous grains. The mass density distribution of the dust is hence given by
![\begin{equation*}\rho_{\text{dust}}(r,z,s,\Phi)\,{=}\, \frac{\Sigma_{\text{dust}}(r)}{\sqrt{2\pi}\,h_{\text{dust}}(r,s,\Phi)}\!\cdot\exp{\left[-\frac{1}{2}\left(\frac{z}{h_{\text{dust}}(r,s,\Phi)}\right)^2\right]} \end{equation*}](/articles/aa/full_html/2021/04/aa40033-20/aa40033-20-eq15.png) (5)
(5)
and the dust surface density by
with thedust-to-gas ratio fd/g = 1∕100.
The dust model differs slightly from the model described in Sect. 2.1. Whereas in the previous section the optical quantities, for instance, the cross-sections, were averaged over the entire size distribution for simplicity, during the radiative transfer simulation, the size as well as the corresponding optical quantities of a grain were determined probabilistically for each individual interaction event (scattering or absorption). To achieve ample sampling, we used a total of 1000 logarithmically spaced grain sizes to represent the entire distribution. Furthermore, a mixture of 62.5% astrosil and 37.5% graphite (1∕3–2∕3 approximation; Draine & Malhotra 1993) was used.
To account for dust settling, the size-dependent scale height given by Eqs. (3) and (4) was calculated for ten logarithmically spaced size bins. These bins cover the entire range of grain sizes from smin to smax. Thus, the net density distribution is given by superposition, that is, the sum of ten individual density distributions characterised by their individual grain size ranges; for details, see also Brunngräber & Wolf (2020). The parameter values of the reference disk model and the central star are identical to those of the reference model of Brunngräber & Wolf (2020); see Table 1.
Disk and stellar parameter values of our reference case.
3.2 Results
In this section, we present the outcome of the radiative transfer simulations. In order to derive spatially resolved polarisation maps, we first calculated the temperature distribution of the dust. The sole heating source is a central star with an effective temperature of T⋆ = 4050 K and a luminosity of L⋆ = 0.9 L⊙, representinga low-luminous but typical T Tauri star (see e.g. the compilation in Table F.1. in Varga et al. 2018). Based on the derived self-consistent temperature distribution, the radiative transfer of the thermal re-emission of the dust and thus the resulting intensity maps were simulated atλ = 850 μm, the same wavelength as in Sect. 2. The observable flux represents a combination of the unpolarised direct emission and the scattered radiation. In the following, we separate these two individual contributions. To compare the results of models with different filling factors, we present radial profiles of the degree of polarisation both for the scattered and the total flux and the flux ratio of direct to scattered radiation. More details on the simulation process and extraction of the radial profiles can be found in Brunngräber & Wolf (2020).
First, we focus on the scattered radiation. In this way, the comparison to the results of the simple approach in Sect. 2 is straightforward. In the upper row of Fig. 3, radial profiles of the polarisation degree for the scattered flux only for different filling factors Φ are shown. The polarisation of pure scattering increases with decreasing filling factor (different colours), which is a direct consequence of an increasing ratio of the Müller matrix elements S12 ∕S11; see also the upper left panel of Fig. 1. In addition, the general shape of the radial profiles is determined by the degree of anisotropy of the local radiation field. An anisotropic radiation field is one of the main requirements for polarisation due to scattering of thermal re-emission radiation (Kataoka et al. 2015; Heese et al. 2020; Brunngräber & Wolf 2020). In the inner regions of the disk, the radiation field is close to isotropic because of the axisymmetric density and temperaturedistribution. However, the local radiation field becomes increasingly anisotropic with larger orbital radii r. This is caused by the decreasing temperature, and hence flux, for larger distances. Consequently, the degree of polarisation increases towards the outer regions of the disk.
Both a lower disk mass (first column in Fig. 3) and a smaller maximum grain size (third column) increase the polarisation of scattered flux. In both cases, the temperature in the upper layers of the disk is higher than in the reference case (solid lines in all four columns). The resulting steeper vertical temperature gradient causes the anisotropy of the local radiation field and thus the polarisation degree to increase. Additionally, for a smaller maximum grain size, the single-scattering polarisation p is significantly higher than in the reference case; see the upper left panel of Fig. 1. Similarly, the scattering polarisation decreases for increasing disk masses (second column) and maximum grain sizes (fourth column).
Nonetheless, a high degree of scattering polarisation is not the only prerequisite for a high net polarisation degree combining scattered and direct radiation. The flux ratio of scattered to direct radiation is shown in the middle row of Fig. 3. A high flux ratio (≫ 1) represents the case in which the total flux is dominated by scattering and thus the degree of polarisation is similar to the case with scattered flux only. However, for our simulations, the ratio is well below unity in most considered cases (down to ~ 210−2 for compact dust and even lower for porous grains), and thus the direct unpolarised radiation contributes much more to the overall flux than the scattered flux. In most of the cases shown in Fig. 3, the flux ratio decreases for a decreasing filling factor Φ because of two reasons. First, the extinction cross-section decreases for more porous grains. Second, the product of albedo, single-scattering polarisation, and probability for a scattering angle of 90 ° also decreases for lower filling factors; see the lower left panels of Figs. 1 and 2. In addition, for constant optical properties, the ratio of scattered to direct flux is essentially governed by the optical depth towards the observer. Thus, in the case of a lower or higher disk mass, the ratio decreases or increases, respectively, by the same factor as the mass. However, considering different maximum grain sizes, the flux ratio is also a function of the extinction opacity κext and the product of albedo, single-scattering polarisation, and probability distribution of the scattering angle. As a result, the flux ratio decreases by different amounts for most of the simulations with smaller and larger maximum grain sizes. One exception is the combination of a low filling factor of Φ = 10−2 and a maximum grain size of smax = 10 mm represented by the dashed red line in the fourth column of Fig. 3. Here, both the albedo and the extinction cross-section increase for the larger maximum grain size.
The combination of the scattering polarisation degree and the flux ratio of scattered to direct radiation yields the overall degree of polarisation of the total flux; see the lower panels of Fig. 3. For most disk models, the net polarisation first increases with decreasing filling factor, and after reaching a maximum value, it decreases again. This is the result of two counteracting effects: on the one hand, there is the already mentioned steadily increasing degree of polarisation of pure scattering. On the other hand, there is the steep drop of the flux ratio with decreasing filling factors. Theonly exception within the considered parameter space is the disk with a smaller maximum grain size of smax = 100 μm. Here, the maximum polarisation is produced by compact grains and is reduced for more porous grains, which is also shown in Fig. 2. Compared to the reference case, the net polarisation increases for a higher disk mass because the disk becomes optically thick and for a smaller maximum grain size due to the increase in scattering polarisation. In general, the net polarisation degree of the total flux is reduced significantly compared to the case of scattered radiation only. Furthermore, the shape of the radial profile changes and now decreases towards larger radii after a maximum degree of polarisation. Its position in the disk is governed by the ratio of the scattered to direct unpolarised flux. For optically thin disks, the maximum is located at the inner rim of the disk and is shifted farther out with increasing optical depth2. The position of maximum polarisation degree can therefore be used to determine the transition from optically thick to optically thin (Brunngräber & Wolf 2020).
Although the degree of polarisation increases for porous grains, it is still significantly lower than those observed, which typically yield polarisation degrees of about a few percent. The main cause, as discussed, is the relatively low contribution of the scattered radiation to the total radiation. At first glance, an increase in this contribution and thus of the resulting polarisation degree can be achieved by assuming an increased maximum grain size, and thus a greater effect of large grains with large extinction cross-sections. However, our simulations show that this conclusion is not correct. In the left column of Fig. 4, the radial profiles for disks containing grains with different maximum radii and a filling factor of Φ = 10−1 are directly compared for three different total dust masses. For the chosen wavelength of λ = 850 μm, the scattered to direct flux ratio is very similar for disks containing dust distributions with maximum radii of smax = 1 mm (green) and 10 mm (red). This is because opacity and albedo are very similar as well. The main difference between these two simulations is the polarisation after single scattering p (upper left panel of Fig. 1), which decreases from 0.87 to 0.55 for the larger maximum grain size. At the same time, more of the larger grains are present in the disk, which tends to have lower equilibrium temperatures. Thus, the anisotropy of the radiation field is reduced as well. Both the lower temperature and the lower single-scattering polarisation lead to a reduced degree of polarisation for scattering only (upper left panel of Fig. 4) and to a reduced overall degree of polarisation (lower left panel of Fig. 4). A smaller maximum grain size, however, may lead to an increased net polarisation degree. Although the opacity, and thus the optical depth, is lower by about a factor 16 than the reference case for smax = 100 μm, the net polarisation is higher by a factor 1.15 due to the higher single-scattering polarisation, the steeper temperature distribution of the smaller grains, and the resulting high radiation field anisotropy. A maximum grain size of only 100 μm does not agree either with the commonly accepted dust and disk evolution models, however, nor do these models predict a sharp decrease of the grain size distribution beyond this value.
Another possibility to increase the degree of polarisation might be to change the grain size distribution. In our reference model, the size distribution has a power-law exponent of q = −3.5. In Appendix A, the corresponding plots of the optical properties for different exponents can be found. The scattering polarisation steadily increases for steeper grain size distributions; see the upper right panel of Fig. 4. This is again due to the larger amount of smaller grains, which have a steeper temperature distribution and a higher single-scattering polarisation. The flux ratio of scattered to direct radiation, on the other hand, is only slightly altered. Thus, the overall degree of polarisation for compact and moderately porous grains increases for steeper grain size distributions as well. Nevertheless, the polarisation degree is still below the observed values.
Brunngräber & Wolf (2020) showed that a larger scale height of the dust distribution increases the polarisation degree. This is even more pronounced for porous grains, as is shown in the left column of Fig. 5. The net polarisation rises above 0.6% for an intermediate filling factor Φ = 10−1 (green) and a scale height twice as large as the reference case href = 20 au (dashed). Although there is observational evidence for such large scale heights, most studies tend towards smaller scale heights of about 10 au or smaller (Stapelfeldt et al. 1998; Andrews et al. 2010; Woitke et al. 2019; Villenave et al. 2020). When only the scale heights of the largest grains are increased by discarding the dust settling, the polarisation also increases up to about 0.5%; see the left column of Fig. 5. This is again contrary to the expected dust distribution from evolutionary models.
Driven by the goal to achieve a higher opacity and single-scattering polarisation and thus to reproduce the generally observed polarisation degree in the order of a few percent, a high amount of carbonaceous dust was considered by Yang & Li (2020). We partially confirm their findings. When we increased the fraction of graphite in our dust model from 37.5% to 60%, the polarisation indeed increased, but only by a small amount, and the polarisation is still well below 1%. The maximum value is about 0.3%; see Fig. 6. This means that a large graphite fraction alone does not sufficiently increase the polarisation degree.
As already shown in several studies (e.g. Yang et al. 2016, 2017), the polarisation degree also depends on the disk inclination. We confirm these findings as shown in Fig. 7 with our reference model and an inclination of 45°. Whereas the polarisation of scattered flux only is very similar for both viewing angles, the ratio of the scattered to direct flux increases especially atthe near side of the disk, and hence the increased net polarisation fraction up to 1.9% in the innermost regions for a filling factor of 0.1 (middle panel). This inclination-induced increase of the polarisation arises because the scattering angle and the resulting polarisation is different for radiation parallel to the major disk axis than for radiation parallel to the minor disk axis. Thus, the superposition of these contributions is less destructive and hence results in a lower decrease in polarisation degree than in the face-on case, where the scattering angles towards the observer at a given point in the disk are very similar for radiation from all directions. This is described in detail in Yang et al. (2016). Thus, with an inclined disk consisting of moderately porous mm-sized grains, we are able to achieve levels of polarisation that are comparable to selected observations (Bacciotti et al. 2018; Lee et al. 2018; Mori et al. 2019; Ohashi & Kataoka 2019). These trends concerning filling factor, size distribution, and density distribution still hold for inclined disks. Additionally, we stress that the disk mass has a significant effect on the level and spatial distribution of the polarisation degree for inclined disks through the optical depth. The optical depth and the mass under the assumption of a known dust model can therefore in principle be constrained by spatially resolved polarisation observations; see Fig. 8.
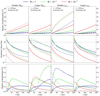 |
Fig. 3 Radial profiles of different quantities for disks with different filling factors (colours). The reference disk model (solid lines) is shown in a comparison with different disk models (dashed lines): a disk with a dust mass Mdust = 10−5 M⊙ lower by a factor of 10 (first column), a disk with a dust mass Mdust = 10−3 M⊙ higher by a factor ten (second column), a disk with a maximum grain size smax = 100 μm smaller by a factor ten (third column), and a disk with a maximum grain size smax = 10 mm larger by a factor ten (fourth column). Top: degree of polarisation for scattering only, i.e. without the unpolarised direct re-emission. Middle: flux ratio of scattered to direct re-emission. Bottom: net degree of polarisation of the total flux, i.e. scattered and direct radiation, including vertical error bars. |
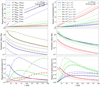 |
Fig. 4 Same as Fig. 3, but for (left) disks with different dust masses (line style) and upper grain size limits (colours), and for (right) disks with different filling factors (colour) and exponents of the grain size distribution (line style). |
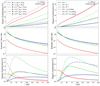 |
Fig. 5 Same as Fig. 3, but for disks with different filling factors (colour) and reference scale heights (left), and withoutdust settling (right). |
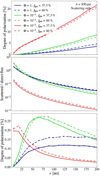 |
Fig. 6 Same as Fig. 3, but for disks with different filling factors (colours) and mass fraction of graphite in the dust model (line style). |
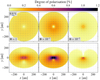 |
Fig. 7 Map of the polarisation degree with superimposed polarisation vectors for our reference disk with Φ = 1 (left), 10−1 (centre), and 10−2 (right), and an inclination of i = 0° (top) and 45° (bottom). The lengths of the polarisation vectors are scaled to the polarisation degree, as indicated in the top left corner. |
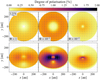 |
Fig. 8 Same as Fig. 7, but for a disk with a 10 times higher dust mass. The lengths of the polarisation vectors are scaled to the polarisation degree, as indicated in the top left corner. |
4 Discussion
The degree of polarisation resulting from our simulations is in most cases lower by a factor of 2 to 3 than what is observed in several protoplanetary disks where the polarisation is thought to result from scattering. Although both albedo ω and single-scattering polarisation p = −S12∕S11 imply a high degree of polarisation for decreasing filling factors Φ, the net degree of polarisation of the total radiation increases only for a small range of filling factors before decreasing towards even lower filling factors. This decrease in polarisation after reaching a maximum value at about Φ = 0.1 is due to the decrease in extinction opacity of the dust grains and the resulting low optical depth, and hence a decrease in the scattering probability.
This might in principle be addressed by different modifications of the model. To increase the optical depth and thus the scattering probability, intuitive steps would be to increase the disk mass, the maximum grain size, or use a more shallow grain size distribution. However, these changes do not necessarily lead to higher polarisation degrees, as seen in the previous section. Yang & Li (2020) showed that a high abundance of carbonaceous material would increase the single-scattering polarisation as well. Appendix A shows that the opacity and albedo are indeed higher than in astrosil grains. However, our reference dust model already contains 37.5% graphite (mass fraction). Even a larger fraction of 60% graphite increases the polarisation only by a small amount, the maximum degree of polarisation is still below 0.3% for a face-on disk.
Although the degree of polarisation significantly increases for inclined disks, by a factor of about 4 for our reference disk and an inclination of 45°, it remains below most of the observed polarisation degrees when compact grains are assumed. For a moderate filling factor of 0.1, our simulations reach polarisation degrees of 1.9% in the innermost disk regions, which is in agreement with several observations. An only moderately porous dust phase is also in agreement with recent studies concerning the interstellar medium (Hirashita et al. 2021; Draine & Hensley 2021), and the rotational disruption of dust grains in protoplanetary disks (Tatsuuma & Kataoka 2021). Furthermore, the polarisation of inclined disks follows the same trends concerning the filling factor as mentioned above in the face-on case.
Nevertheless, the spectral index of our simulated disks between the wavelengths λ = 1.3 mm and 2 mm significantly increases for porous grains compared to compact grains. This is in contrast to many observations of protoplanetary disks where the spectral index at mm wavelengths is found to be in the range between 2 and 2.5 which is commonly interpreted as evidence for large grains (Andrews & Williams 2005). In our simulations, however, the spectral index of disks consisting of porous grains is larger than 3 and is as high as 3.8 for low-mass disks. Thus, our results suggest that the grain porosity  in protoplanetary disks does not exceed 0.9 significantly and may be even lower. Although this is in agreement with Tazaki et al. (2019), for instance, it cannot be ruled out that larger dust grains of about several cm in radius are present in the disk and depress the spectral index. At the same time, however, this would decrease the polarisation fraction.
A common suggestion for increasing the scattering polarisation in disk models without the inherent problem with the spectral index in the case of porous grains outlined above is introducing non-spherical dust grains. Kirchschlager & Bertrang (2020) showed that non-spherical compact, that is, non-porous, silicate dust grains might show a higher single-scattering polarisation degree. The complexity of the dust model increases significantly with non-spherical dust grains, and the prediction of whether the observable degree of polarisation would increase or decrease is not straightforward. This uncertainty is even larger as the alignment efficiency and the dominating alignment mechanism in protoplanetary disks is still unclear. In addition to the polarisation degree, the observed orientations place further constraints on the origin of the polarisation and need to be accounted for as well. A proper investigation including extensive Monte Carlo radiative transfer simulations remains to be done.
5 Summary
We investigated the effect of dust grain porosity on the polarisation degree due to scattering of thermal re-emission radiation in the sub-mm wavelength range. For this purpose, we analysed the optical properties of grain size distributions with different filling factors and upper grain size limits. This analysis approach is independent of any underlying density distribution and thus independent of the local radiation field, and allows general discussions of the polarisation.
We showed that focussing on the single-scattering polarisation p = −S12∕S11 and the albedo ω is not sufficient for reliable estimates of the overall degree of polarisation. We stress that the extinction opacity and the flux distribution for different scattering angles have to be included in these considerations. Especially for larger grains, the scattered flux decreases dramatically for scattering angles close to 90 ° as large grains tend to show a strong forward-scattering behaviour. Furthermore, increasing the upper grain size limit does not necessarily increase the opacity or optical depth of the entire dust phase. Although the extinction cross-section is approximately proportional to the grain surface and thus to s2, the actual number of dust grains is indirectly proportional to the grain mass, that is, to s−3, resulting in a decrease in opacity.
In the second part of our study, full radiative transfer simulations of typical protoplanetary disks with porous dust grains were conducted. Here, the largest grains are already settled towards the midplane to account for dust settling. It was shown that introducing porosity may increase the degree of polarisation by up to a factor of four. However, decreasing the filling factor below ~ 0.1 will decrease thedegree of polarisation for even lower filling factors because of the low opacity and optical depth. The flux of the unpolarised direct emission of the dust becomes much higher than the scattered flux, which effectively decreases the polarisation. Furthermore, the spectral index of disks consisting of porous grains is significantly larger than observed.
In the face-on case, increasing the anisotropy of the radiation field by larger temperature differences in the disk may lead to polarisation degrees in the order of what is observed in protoplanetary disks. This can be achieved for instance by rather small upper grain size limits in the order of 100 μm or a significant overabundance of grains in that size range, or by a high anisotropy of the radiation field due to rather extreme density distributions, caused by large scale heights, for example. Both are very unlikely scenarios for typical protoplanetary disks according to current disk and dust evolution models.
For inclined disks, our simulations are able to reproduce polarisation degrees of 1.2% and higher with our reference disk model including mm-sized grains, moderate porosity, dust settling, and reasonable (i.e. in agreement with accepted evolution theories and observations) geometrical disk properties. However, the spectral index of these simulations does not reproduce the observed values in the mm wavelength range.
The mismatch between the spatially resolved polarimetric observations at sub-mm wavelengths, the observed spectral index and the predicted values resulting from theoretical models, and the interpretation of a wealth of previous observations of dust in protoplanetary disks remains an open issue that urgently needs to be further addressed in future studies.
Acknowledgement
This research was funded through the DFG grant WO 857/18-1. This research made use of Astropy (http://www.astropy.org), a community-developed core Python package for Astronomy (Astropy Collaboration 2018).
Appendix A Optical properties for further dust mixtures
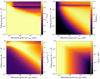 |
Fig. A.1 Degree of polarisation for single scattering p = −S12∕S11 for a scattering angle of θ = 90° (upper left), albedo (upper right), extinction opacity (lower left), and probability density function Ŝ11 for the scattering angle θ = 90° (lower right). All quantities were calculated for a grain size distribution with q = −3.5, smin = 5 nm, and different upper grain size limits smax at a wavelength of 850 μm for graphite (parallel). |
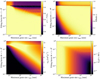 |
Fig. A.2 Degree of polarisation for single scattering p = −S12∕S11 for a scattering angle of θ = 90° (upper left), albedo (upper right), extinction opacity (lower left), and probability density function Ŝ11 for the scattering angle θ = 90° (lower right). All quantities were calculated for a grain size distribution with q = −3.5, smin = 5 nm, and different upper grain size limits smax at a wavelength of 850 μm for graphite (perpendicular). |
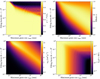 |
Fig. A.3 Degree of polarisation for single scattering p = −S12∕S11 for a scattering angle of θ = 90° (upper left), albedo (upper right), extinction opacity (lower left), and probability density function Ŝ11 for the scattering angle θ = 90° (lower right). All quantities were calculated for a grain size distribution with q = −3.2, smin = 5 nm, and different upper grain size limits smax at a wavelength of 850 μm for astrosil. |
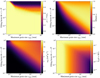 |
Fig. A.4 Degree of polarisation for single scattering p = −S12∕S11 for a scattering angle of θ = 90° (upper left), albedo (upper right), extinction opacity (lower left), and probability density function Ŝ11 for the scattering angle θ = 90° (lower right). All quantities were calculated for a grain size distribution with q = −3.8, smin = 5 nm, and different upper grain size limits smax at a wavelength of 850 μm for astrosil. |
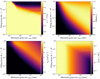 |
Fig. A.5 Degree of polarisation for single scattering p = −S12∕S11 for a scattering angle of θ = 90° (upper left), albedo (upper right), extinction opacity (lower left), and probability density function Ŝ11 for the scattering angle θ = 90° (lower right). All quantities were calculated for a grain size distribution with q = −3.5, smin = 5 nm, and different upper grain size limits smax at a wavelength of 1.3 mm for astrosil. |
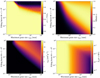 |
Fig. A.6 Degree of polarisation for single scattering p = −S12∕S11 for a scattering angle of θ = 90° (upper left), albedo (upper right), extinction opacity (lower left), and probability density function Ŝ11 for the scattering angle θ = 90° (lower right). All quantities were calculated for a grain size distribution with q = −3.5, smin = 5 nm, and different upper grain size limits smax at a wavelength of 2 mm for astrosil. |
References
- Abe, M., Takagi, Y., Kitazato, K., et al. 2006, Science, 312, 1334 [Google Scholar]
- A’Hearn, M. F., Belton, M. J. S., Delamere, W. A., et al. 2005, Science, 310, 258 [Google Scholar]
- Andrews, S. M., & Williams, J. P. 2005, ApJ, 631, 1134 [Google Scholar]
- Andrews, S. M., Wilner, D. J., Hughes, A. M., Qi, C., & Dullemond, C. P. 2010, ApJ, 723, 1241 [Google Scholar]
- Andrews, S. M., Huang, J., Pérez, L. M., et al. 2018, ApJ, 869, L41 [Google Scholar]
- Astropy Collaboration (Price-Whelan, A. M., et al.) 2018, AJ, 156, 123 [Google Scholar]
- Avenhaus, H., Quanz, S. P., Garufi, A., et al. 2018, ApJ, 863, 44 [Google Scholar]
- Bacciotti, F., Girart, J. M., Padovani, M., et al. 2018, ApJ, 865, L12 [Google Scholar]
- Beckwith, S. V. W., & Sargent, A. I. 1991, ApJ, 381, 250 [Google Scholar]
- Blum, J., & Wurm, G. 2008, ARA&A, 46, 21 [Google Scholar]
- Blum, J., Wurm, G., Kempf, S., et al. 2000, Phys. Rev. Lett., 85, 2426 [Google Scholar]
- Brownlee, D. E., Tomandl, D. A., & Olszewski, E. 1977, in Lunar and Planetary Science Conference Proceedings, 8, ed. R. B. Merril, 149 [Google Scholar]
- Bruggeman, D. A. G. 1935, Ann. Phys., 416, 636 [Google Scholar]
- Brunngräber, R., & Wolf, S. 2019, A&A, 627, A10 [EDP Sciences] [Google Scholar]
- Brunngräber, R., & Wolf, S. 2020, A&A, 640, A122 [CrossRef] [EDP Sciences] [Google Scholar]
- Dent, W. R. F., Pinte, C., Cortes, P. C., et al. 2019, MNRAS, 482, L29 [Google Scholar]
- Draine, B. T. 2003, ApJ, 598, 1026 [Google Scholar]
- Draine, B. T., & Hensley, B. S. 2021, ApJ, submitted [arXiv:2101.07277] [Google Scholar]
- Draine, B. T., & Malhotra, S. 1993, ApJ, 414, 632 [Google Scholar]
- Dubrulle, B., Morfill, G., & Sterzik, M. 1995, Icarus, 114, 237 [NASA ADS] [CrossRef] [Google Scholar]
- Dullemond, C. P., & Dominik, C. 2004, A&A, 421, 1075 [NASA ADS] [CrossRef] [EDP Sciences] [Google Scholar]
- Garcia, A. J. L., & Gonzalez, J.-F. 2020, MNRAS, 493, 1788 [Google Scholar]
- Goldreich, P., & Ward, W. R. 1973, ApJ, 183, 1051 [Google Scholar]
- Gräfe, C., Wolf, S., Guilloteau, S., et al. 2013, A&A, 553, A69 [NASA ADS] [CrossRef] [EDP Sciences] [Google Scholar]
- Guilloteau, S., Piétu, V., Chapillon, E., et al. 2016, A&A, 586, A1 [NASA ADS] [CrossRef] [EDP Sciences] [Google Scholar]
- Harris, R. J., Cox, E. G., Looney, L. W., et al. 2018, ApJ, 861, 91 [Google Scholar]
- Hartmann, L., Calvet, N., Gullbring, E., & D’Alessio, P. 1998, ApJ, 495, 385 [NASA ADS] [CrossRef] [Google Scholar]
- Heese, S., Wolf, S., & Brauer, R. 2020, A&A, 634, A129 [CrossRef] [EDP Sciences] [Google Scholar]
- Hirashita, H., Il’in, V. B., Pagani, L., & Lefévre, C. 2021, MNRAS, 502, 15 [Google Scholar]
- Hull, C. L. H., Yang, H., Li, Z.-Y., et al. 2018, ApJ, 860, 82 [Google Scholar]
- Kataoka, A., Okuzumi, S., Tanaka, H., & Nomura, H. 2014, A&A, 568, A42 [NASA ADS] [CrossRef] [EDP Sciences] [Google Scholar]
- Kataoka, A., Muto, T., Momose, M., et al. 2015, ApJ, 809, 78 [Google Scholar]
- Kataoka, A., Muto, T., Momose, M., Tsukagoshi, T., & Dullemond, C. P. 2016, ApJ, 820, 54 [Google Scholar]
- Kenyon, S. J., & Hartmann, L. 1995, ApJS, 101, 117 [Google Scholar]
- Kirchschlager, F., & Bertrang, G. H. M. 2020, A&A, 638, A116 [CrossRef] [EDP Sciences] [Google Scholar]
- Kothe, S., Blum, J., Weidling, R., & Güttler, C. 2013, Icarus, 225, 75 [Google Scholar]
- Lee, C.-F., Li, Z.-Y., Ching, T.-C., Lai, S.-P., & Yang, H. 2018, ApJ, 854, 56 [Google Scholar]
- Lin, Z.-Y. D., Li, Z.-Y., Yang, H., et al. 2020, MNRAS, 496, 169 [Google Scholar]
- Lynden-Bell, D., & Pringle, J. E. 1974, MNRAS, 168, 603 [NASA ADS] [CrossRef] [Google Scholar]
- Mathis, J. S., Rumpl, W., & Nordsieck, K. H. 1977, ApJ, 217, 425 [NASA ADS] [CrossRef] [Google Scholar]
- Mie, G. 1908, Ann. Phys., 330, 377 [Google Scholar]
- Mori, T., Kataoka, A., Ohashi, S., et al. 2019, ApJ, 883, 16 [Google Scholar]
- Ohashi, S., & Kataoka, A. 2019, ApJ, 886, 103 [Google Scholar]
- Ohashi, S., Kataoka, A., Van der Marel, N., et al. 2020, ApJ, 900, 81 [Google Scholar]
- Pinte, C., Dent, W. R. F., Ménard, F., et al. 2016, ApJ, 816, 25 [Google Scholar]
- Reissl, S., Wolf, S., & Brauer, R. 2016, A&A, 593, A87 [NASA ADS] [CrossRef] [EDP Sciences] [Google Scholar]
- Sadavoy, S. I., Stephens, I. W., Myers, P. C., et al. 2019, ApJS, 245, 2 [Google Scholar]
- Safronov, V. S. 1972, Evolution of the protoplanetary cloud and formation of the Earth and planets, ed. I. P. for Scientific Translations (Keter Publishing House) [Google Scholar]
- Stapelfeldt, K. R., Krist, J. E., Ménard, F., et al. 1998, ApJ, 502, L65 [Google Scholar]
- Stephens, I. W., Yang, H., Li, Z.-Y., et al. 2017, ApJ, 851, 55 [Google Scholar]
- Tatsuuma, M., & Kataoka, A. 2021, ApJ, submitted [arXiv:2101.04910] [Google Scholar]
- Tazaki, R., Tanaka, H., Kataoka, A., Okuzumi, S., & Muto, T. 2019, ApJ, 885, 52 [Google Scholar]
- Testi, L., Birnstiel, T., Ricci, L., et al. 2014, in Protostars and Planets VI, eds. H. Beuther, R. S. Klessen, C. P. Dullemond, & T. Henning, 339 [Google Scholar]
- Varga, J., Ábrahám, P., Chen, L., et al. 2018, A&A, 617, A83 [NASA ADS] [CrossRef] [EDP Sciences] [Google Scholar]
- Villenave, M., Menard, F., Dent, W. R. F., et al. 2020, A&A 642, A164 [EDP Sciences] [Google Scholar]
- Westphal, A. J., Stroud, R. M., Bechtel, H. A., et al. 2014, Science, 345, 786 [Google Scholar]
- Woitke, P., Min, M., Pinte, C., et al. 2016, A&A, 586, A103 [NASA ADS] [CrossRef] [EDP Sciences] [Google Scholar]
- Woitke, P., Kamp, I., Antonellini, S., et al. 2019, PASP, 131, 064301 [Google Scholar]
- Wolf, S., & Voshchinnikov, N. V. 2004, Comput. Phys. Commun., 162, 113 [Google Scholar]
- Yang, H., & Li, Z.-Y. 2020, ApJ, 889, 15 [Google Scholar]
- Yang, H., Li, Z.-Y., Looney, L., & Stephens, I. 2016, MNRAS, 456, 2794 [Google Scholar]
- Yang, H., Li, Z.-Y., Looney, L. W., Girart, J. M., & Stephens, I. W. 2017, MNRAS, 472, 373 [Google Scholar]
All Tables
All Figures
|
Fig. 1 Degree of polarisation for single scattering p = −S12∕S11 for a scattering angle of θ = 90° (upper left), albedo ω (upper right), extinction opacity (lower left), and probability density function Ŝ11 for the scattering angle θ = 90° (lower right). All quantities are calculated for a grain size distribution with q = −3.5, smin = 5 nm and different upper grain size limits smax at a wavelength of 850 μm for astrosil. |
| In the text | |
|
Fig. 2 Product of albedo ω, single-scattering polarisation p, and probability density function Ŝ11 for the scattering angle θ = 90°. All quantities are calculated for a grain size distribution with q = −3.5, smin = 5 nm and three different maximum grain sizes smax = 100 μm (blue), 1 mm (red), and 10 mm (green) at a wavelength of 850 μm for astrosil; see Sect. 2.3 for the corresponding discussion. |
| In the text | |
|
Fig. 3 Radial profiles of different quantities for disks with different filling factors (colours). The reference disk model (solid lines) is shown in a comparison with different disk models (dashed lines): a disk with a dust mass Mdust = 10−5 M⊙ lower by a factor of 10 (first column), a disk with a dust mass Mdust = 10−3 M⊙ higher by a factor ten (second column), a disk with a maximum grain size smax = 100 μm smaller by a factor ten (third column), and a disk with a maximum grain size smax = 10 mm larger by a factor ten (fourth column). Top: degree of polarisation for scattering only, i.e. without the unpolarised direct re-emission. Middle: flux ratio of scattered to direct re-emission. Bottom: net degree of polarisation of the total flux, i.e. scattered and direct radiation, including vertical error bars. |
| In the text | |
|
Fig. 4 Same as Fig. 3, but for (left) disks with different dust masses (line style) and upper grain size limits (colours), and for (right) disks with different filling factors (colour) and exponents of the grain size distribution (line style). |
| In the text | |
|
Fig. 5 Same as Fig. 3, but for disks with different filling factors (colour) and reference scale heights (left), and withoutdust settling (right). |
| In the text | |
|
Fig. 6 Same as Fig. 3, but for disks with different filling factors (colours) and mass fraction of graphite in the dust model (line style). |
| In the text | |
|
Fig. 7 Map of the polarisation degree with superimposed polarisation vectors for our reference disk with Φ = 1 (left), 10−1 (centre), and 10−2 (right), and an inclination of i = 0° (top) and 45° (bottom). The lengths of the polarisation vectors are scaled to the polarisation degree, as indicated in the top left corner. |
| In the text | |
|
Fig. 8 Same as Fig. 7, but for a disk with a 10 times higher dust mass. The lengths of the polarisation vectors are scaled to the polarisation degree, as indicated in the top left corner. |
| In the text | |
|
Fig. A.1 Degree of polarisation for single scattering p = −S12∕S11 for a scattering angle of θ = 90° (upper left), albedo (upper right), extinction opacity (lower left), and probability density function Ŝ11 for the scattering angle θ = 90° (lower right). All quantities were calculated for a grain size distribution with q = −3.5, smin = 5 nm, and different upper grain size limits smax at a wavelength of 850 μm for graphite (parallel). |
| In the text | |
|
Fig. A.2 Degree of polarisation for single scattering p = −S12∕S11 for a scattering angle of θ = 90° (upper left), albedo (upper right), extinction opacity (lower left), and probability density function Ŝ11 for the scattering angle θ = 90° (lower right). All quantities were calculated for a grain size distribution with q = −3.5, smin = 5 nm, and different upper grain size limits smax at a wavelength of 850 μm for graphite (perpendicular). |
| In the text | |
|
Fig. A.3 Degree of polarisation for single scattering p = −S12∕S11 for a scattering angle of θ = 90° (upper left), albedo (upper right), extinction opacity (lower left), and probability density function Ŝ11 for the scattering angle θ = 90° (lower right). All quantities were calculated for a grain size distribution with q = −3.2, smin = 5 nm, and different upper grain size limits smax at a wavelength of 850 μm for astrosil. |
| In the text | |
|
Fig. A.4 Degree of polarisation for single scattering p = −S12∕S11 for a scattering angle of θ = 90° (upper left), albedo (upper right), extinction opacity (lower left), and probability density function Ŝ11 for the scattering angle θ = 90° (lower right). All quantities were calculated for a grain size distribution with q = −3.8, smin = 5 nm, and different upper grain size limits smax at a wavelength of 850 μm for astrosil. |
| In the text | |
|
Fig. A.5 Degree of polarisation for single scattering p = −S12∕S11 for a scattering angle of θ = 90° (upper left), albedo (upper right), extinction opacity (lower left), and probability density function Ŝ11 for the scattering angle θ = 90° (lower right). All quantities were calculated for a grain size distribution with q = −3.5, smin = 5 nm, and different upper grain size limits smax at a wavelength of 1.3 mm for astrosil. |
| In the text | |
|
Fig. A.6 Degree of polarisation for single scattering p = −S12∕S11 for a scattering angle of θ = 90° (upper left), albedo (upper right), extinction opacity (lower left), and probability density function Ŝ11 for the scattering angle θ = 90° (lower right). All quantities were calculated for a grain size distribution with q = −3.5, smin = 5 nm, and different upper grain size limits smax at a wavelength of 2 mm for astrosil. |
| In the text | |
Current usage metrics show cumulative count of Article Views (full-text article views including HTML views, PDF and ePub downloads, according to the available data) and Abstracts Views on Vision4Press platform.
Data correspond to usage on the plateform after 2015. The current usage metrics is available 48-96 hours after online publication and is updated daily on week days.
Initial download of the metrics may take a while.