Fig. 9
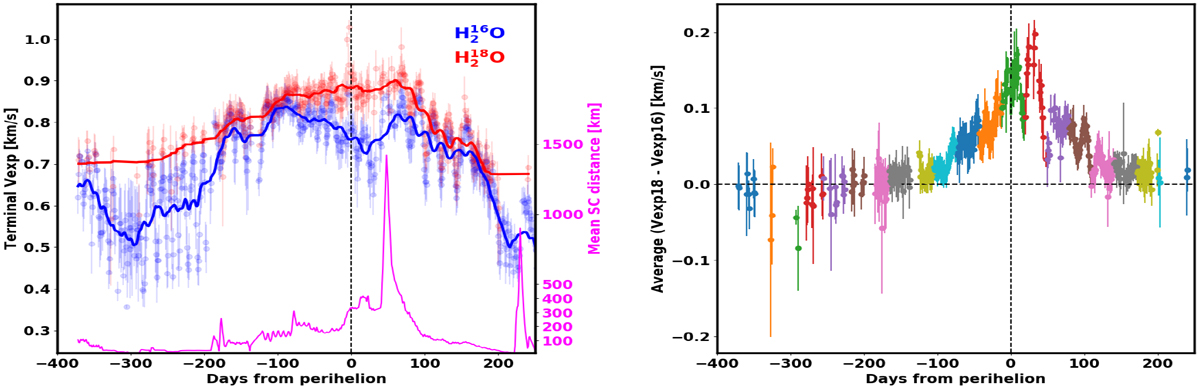
Left: time evolution of estimated TEVs from the two water transitions; the blue points indicate H![]() O and the red points indicate H
O and the red points indicate H![]() O; each point represents a daily mean and the error bars indicate the corresponding standard deviation. The solid red and blue lines denote 30 d running averages. The spacecraft cometo-centric distance is shown in the same panel as the magenta line. Right: daily averaged difference and its standard deviation shown as vertical lines for collocated data points as a function of time. The point clouds of different colors correspond to a different month (August 13, 2015 was the perihelion passage). There is a definite TEV dependence on the heliocentric distance, where the velocities obtained from H
O; each point represents a daily mean and the error bars indicate the corresponding standard deviation. The solid red and blue lines denote 30 d running averages. The spacecraft cometo-centric distance is shown in the same panel as the magenta line. Right: daily averaged difference and its standard deviation shown as vertical lines for collocated data points as a function of time. The point clouds of different colors correspond to a different month (August 13, 2015 was the perihelion passage). There is a definite TEV dependence on the heliocentric distance, where the velocities obtained from H![]() O transitions tend to be larger starting from around May 2015, peaking in August–September 2015, and decreasing again afterward. The maximum differences are on the order of 0.15–0.2 km s−1. See Sect. 4.5 for discussion.
O transitions tend to be larger starting from around May 2015, peaking in August–September 2015, and decreasing again afterward. The maximum differences are on the order of 0.15–0.2 km s−1. See Sect. 4.5 for discussion.
Current usage metrics show cumulative count of Article Views (full-text article views including HTML views, PDF and ePub downloads, according to the available data) and Abstracts Views on Vision4Press platform.
Data correspond to usage on the plateform after 2015. The current usage metrics is available 48-96 hours after online publication and is updated daily on week days.
Initial download of the metrics may take a while.