Open Access
Fig. 7
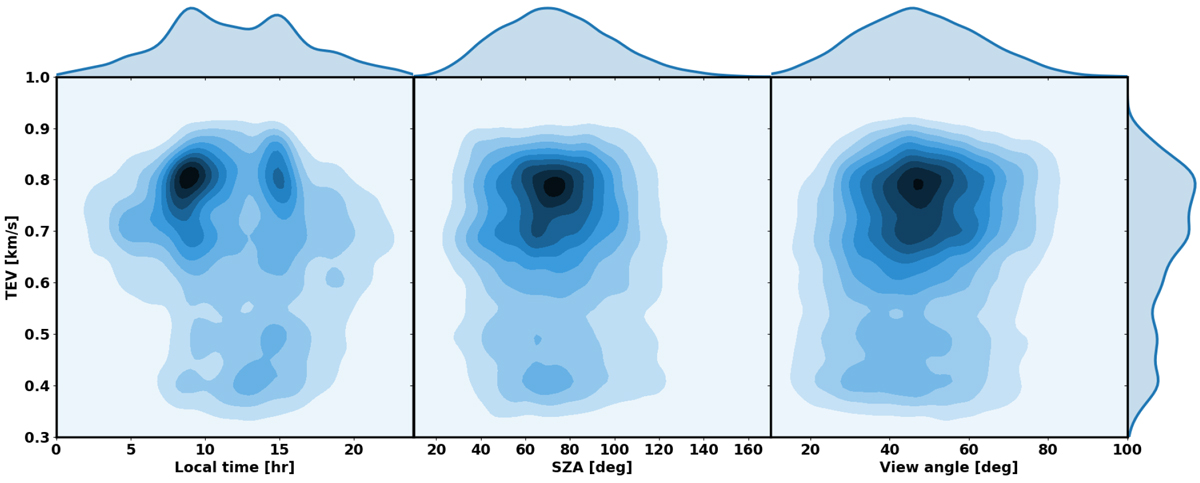
Joint probability/density distributions for H![]() O TEV vs. effective LT (left), SZA (middle), and effective VA (right). The 1D probability distributions of each axis are also shown. See Sect. 4.4 for detailed description and interpretation.
O TEV vs. effective LT (left), SZA (middle), and effective VA (right). The 1D probability distributions of each axis are also shown. See Sect. 4.4 for detailed description and interpretation.
Current usage metrics show cumulative count of Article Views (full-text article views including HTML views, PDF and ePub downloads, according to the available data) and Abstracts Views on Vision4Press platform.
Data correspond to usage on the plateform after 2015. The current usage metrics is available 48-96 hours after online publication and is updated daily on week days.
Initial download of the metrics may take a while.