Fig. 6
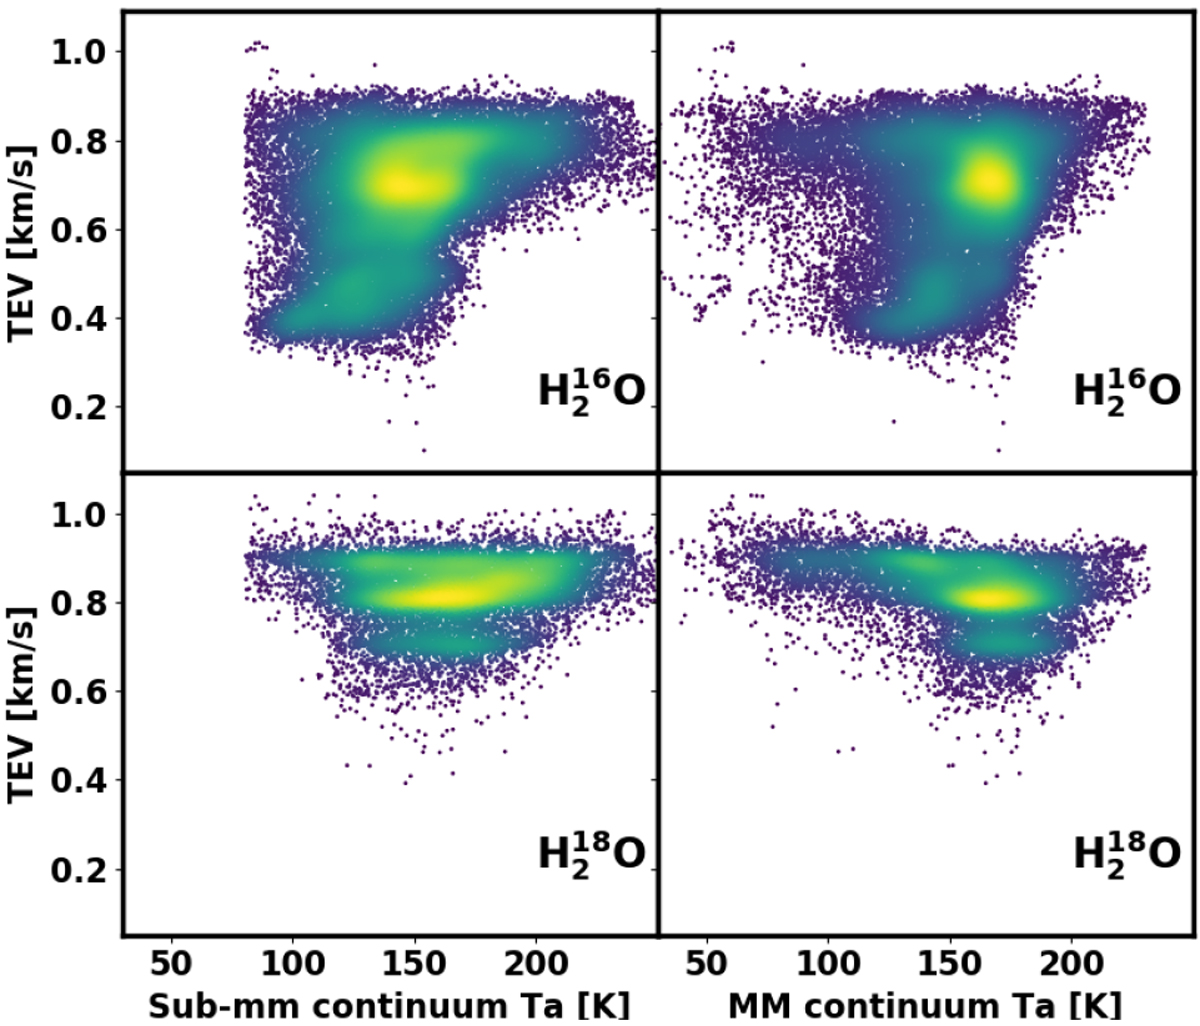
Joint density distribution between derived TEVs and MIRO sub- and millimeter continuum antenna temperatures, The labels in each panel indicate to which isotopolog of water the TEV belongs. The color bar is qualitative, where bright colors indicate a higher frequency of occurrence (yellow) and dark blue represents low frequency of occurrence.
Current usage metrics show cumulative count of Article Views (full-text article views including HTML views, PDF and ePub downloads, according to the available data) and Abstracts Views on Vision4Press platform.
Data correspond to usage on the plateform after 2015. The current usage metrics is available 48-96 hours after online publication and is updated daily on week days.
Initial download of the metrics may take a while.