Fig. 5
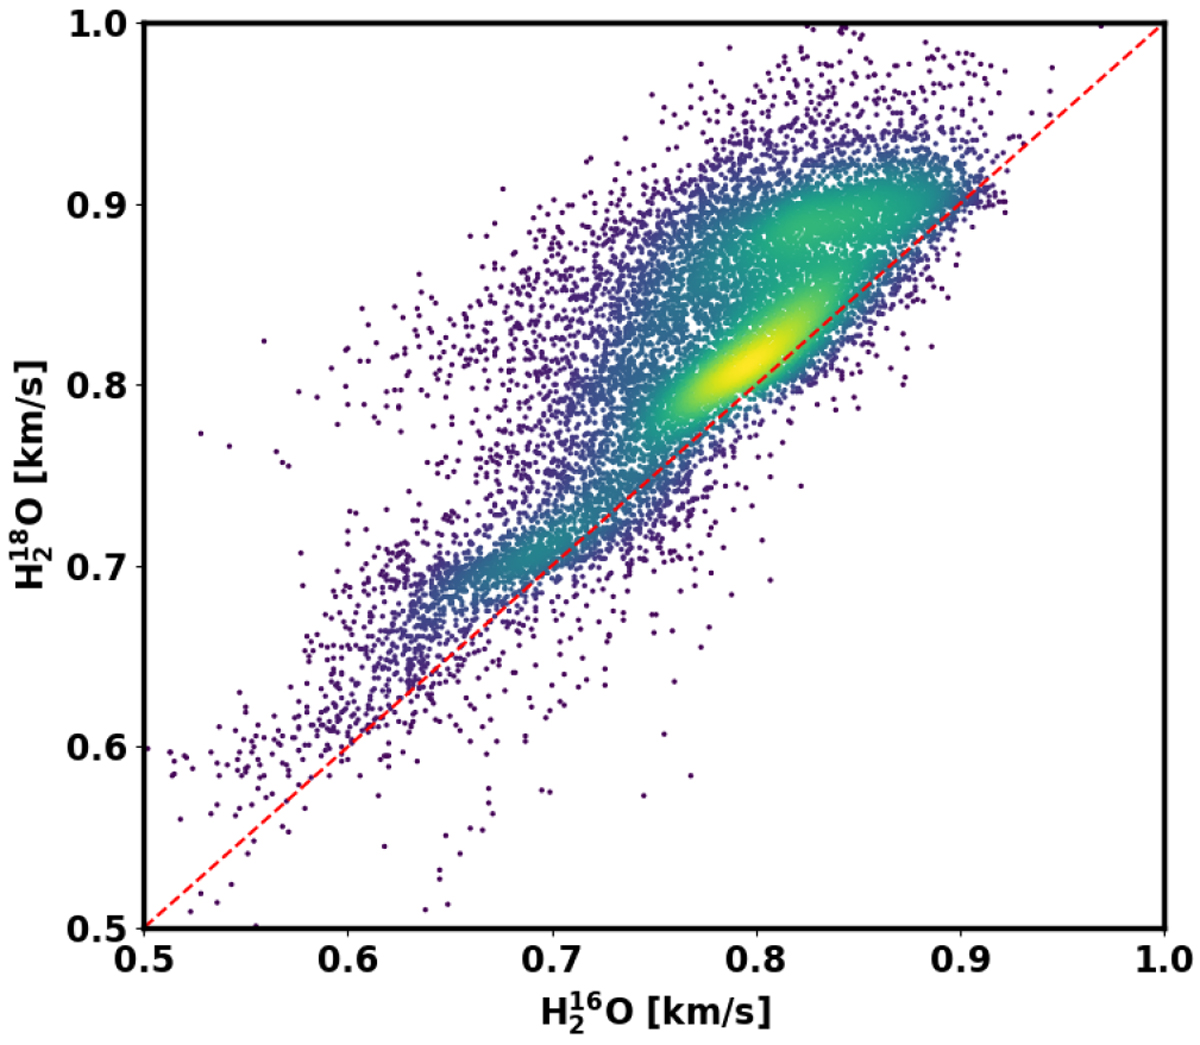
Joint density distribution between TEVs inferred from H![]() O and H
O and H![]() O spectra measured by the MIRO instrument. In this summary plot, all data (from August 2014 until July 2016) are shown excluding cases of low S/N based on the line area. Although there is a strong correlation it is apparent that the H
O spectra measured by the MIRO instrument. In this summary plot, all data (from August 2014 until July 2016) are shown excluding cases of low S/N based on the line area. Although there is a strong correlation it is apparent that the H![]() O spectra yield higher velocity for a considerable fraction of the dataset (see text for details).
O spectra yield higher velocity for a considerable fraction of the dataset (see text for details).
Current usage metrics show cumulative count of Article Views (full-text article views including HTML views, PDF and ePub downloads, according to the available data) and Abstracts Views on Vision4Press platform.
Data correspond to usage on the plateform after 2015. The current usage metrics is available 48-96 hours after online publication and is updated daily on week days.
Initial download of the metrics may take a while.