Fig. 3
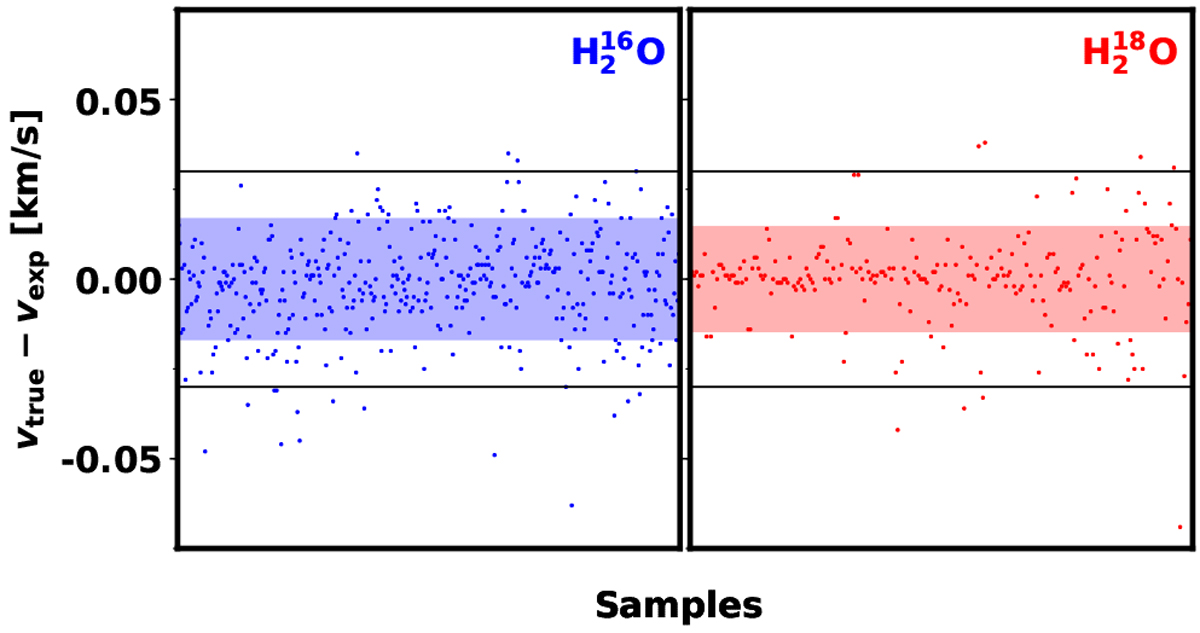
Neural network TEV predictions for H![]() O (blue, left) and H
O (blue, left) and H![]() O (red, right) validation data. The x-axis represents an arbitrary index number of a data point. The scattered points represent the difference between the known terminal velocity (vtrue) of each synthetic spectra and the velocity predicted by the network (vexp). The horizontal black lines indicate ±0.03 km s−1 : the fraction of points enclosed in this region is 95% for H
O (red, right) validation data. The x-axis represents an arbitrary index number of a data point. The scattered points represent the difference between the known terminal velocity (vtrue) of each synthetic spectra and the velocity predicted by the network (vexp). The horizontal black lines indicate ±0.03 km s−1 : the fraction of points enclosed in this region is 95% for H![]() O and 96% for H
O and 96% for H![]() O. The shaded colored region indicate a 1σ
error on the predictions: 0.017 km s−1
for H
O. The shaded colored region indicate a 1σ
error on the predictions: 0.017 km s−1
for H![]() O and 0.015 km s−1
for H
O and 0.015 km s−1
for H![]() O.
O.
Current usage metrics show cumulative count of Article Views (full-text article views including HTML views, PDF and ePub downloads, according to the available data) and Abstracts Views on Vision4Press platform.
Data correspond to usage on the plateform after 2015. The current usage metrics is available 48-96 hours after online publication and is updated daily on week days.
Initial download of the metrics may take a while.