Open Access
Fig. 10
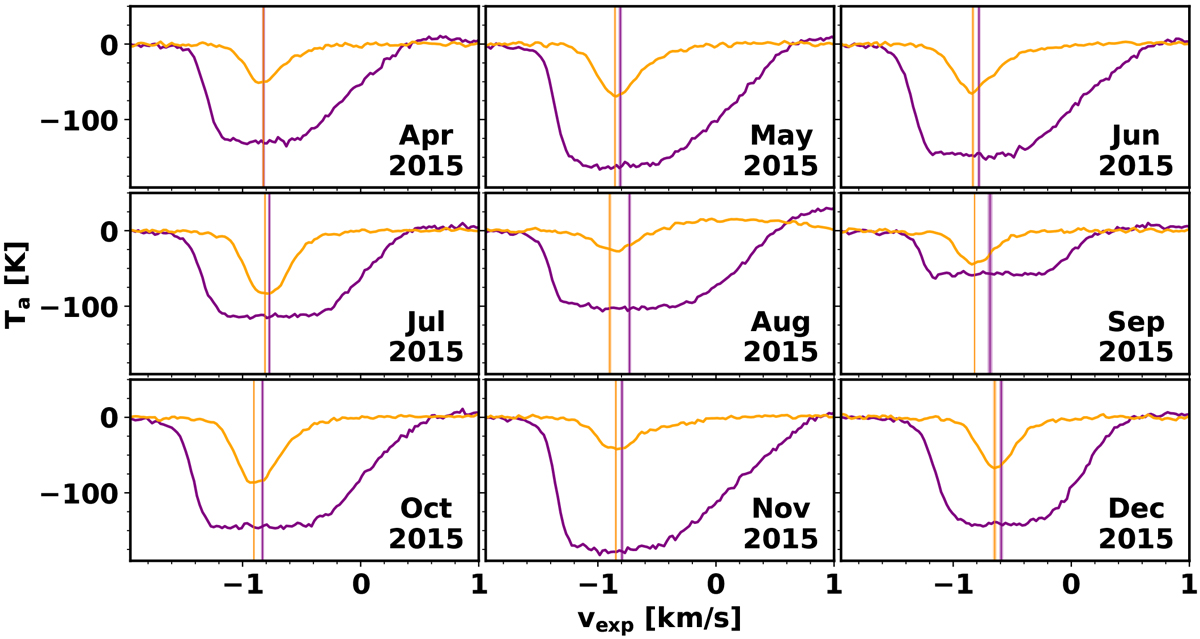
Randomly selected cases of measured spectra and their predicted TEV for each month (as labeled) in 2015. Purple indicates H![]() O spectra and its TEV estimate; orange indicates likewise for H
O spectra and its TEV estimate; orange indicates likewise for H![]() O. The vertical lines indicate the predicted TEV, with the shaded region representing the estimated 1σ
error (see text for details).
O. The vertical lines indicate the predicted TEV, with the shaded region representing the estimated 1σ
error (see text for details).
Current usage metrics show cumulative count of Article Views (full-text article views including HTML views, PDF and ePub downloads, according to the available data) and Abstracts Views on Vision4Press platform.
Data correspond to usage on the plateform after 2015. The current usage metrics is available 48-96 hours after online publication and is updated daily on week days.
Initial download of the metrics may take a while.