| Issue |
A&A
Volume 644, December 2020
|
|
|---|---|---|
| Article Number | A123 | |
| Number of page(s) | 10 | |
| Section | Atomic, molecular, and nuclear data | |
| DOI | https://doi.org/10.1051/0004-6361/202039071 | |
| Published online | 10 December 2020 | |
Reinvestigation of the rotation-tunneling spectrum of the CH2OH radical
Accurate frequency determination of transitions of astrophysical interest up to 330 GHz★
1
Université Paris-Saclay, CNRS, Institut des Sciences Moléculaires d’Orsay,
91405
Orsay, France
e-mail: This email address is being protected from spambots. You need JavaScript enabled to view it.
2
Université Bordeaux, CNRS, Institut des Sciences Moléculaires,
33400
Talence, France
3
Center for Astrochemical Studies, Max-Planck-Institut für extraterrestrische Physik,
Garching, Germany
4
I. Physikalisches Institut, Universität zu Köln,
50937
Köln, Germany
e-mail: This email address is being protected from spambots. You need JavaScript enabled to view it.
Received:
30
July
2020
Accepted:
29
September
2020
Abstract
Context. The hydroxymethyl radical (CH2OH) is one of two structural isomers, together with the methoxy radical (CH3O), that can be produced by abstraction of a hydrogen atom from methanol (CH3OH). In the interstellar medium (ISM), both CH2OH and CH3O are suspected to be intermediate species in many chemical reactions, including those of formation and destruction of methanol. The determination of the CH3O/CH2OH ratio in the ISM would bring important information concerning the formation processes of these species in the gas and solid phases. Interestingly, only CH3O has been detected in the ISM so far, despite the recent first laboratory measurement of the CH2OH rotation-tunneling spectrum. This lack of detection is possibly due to the non-observation in the laboratory of the most intense rotation-tunneling transitions at low temperatures.
Aims. To support further searches for the hydroxymethyl radical in space, we present a thorough spectroscopic study of its rotation-tunneling spectrum, with a particular focus on transitions involving the lowest quantum numbers of the species.
Methods. We recorded the rotation-tunneling spectrum of CH2OH at room temperature in the millimeter-wave domain using a frequency multiplication chain spectrometer. A fluorine-induced H-abstraction method from methanol was used to produce the radical.
Results. About 180 transitions were observed, including those involving the lowest N and Ka quantum numbers, which are predicted to be intense under cold astrophysical conditions. These transitions were fitted together with available millimeter-wave lines from the literature. A systematic observation of all components of the rotational transitions yields a large improvement of the spectroscopic parameters allowing confident searches of the hydroxymethyl radical in cold to warm environments of the ISM.
Key words: methods: laboratory: molecular / techniques: spectroscopic / catalogs / ISM: molecules / submillimeter: general
FIT files are available at the CDS via anonymous ftp to cdsarc.u-strasbg.fr (130.79.128.5) or via http://cdsarc.u-strasbg.fr/viz-bin/cat/J/A+A/644/A123
© O. Chitarra et al. 2020
 Open Access article, published by EDP Sciences, under the terms of the Creative Commons Attribution License (https://creativecommons.org/licenses/by/4.0), which permits unrestricted use, distribution, and reproduction in any medium, provided the original work is properly cited.
1 Introduction
The hydroxymethyl radical, CH2OH, is suspected to participate in the formation and destruction of ubiquitous interstellar methanol and therefore holds a considerable place in many astrochemistry models of the interstellar medium (ISM; e.g., Morisset et al. 2019; Watanabe & Kouchi 2002; Hama & Watanabe 2013). Theoretical and experimental surface chemistry studies tend to indicate that CH2OH should be one of the products of methanol desorption from ice analogues (Wakelam et al. 2017; Bertin et al. 2016; Öberg et al. 2009). This species may also be formed by gas-phase reactions (Balucani et al. 2015; Acharyya et al. 2015; Lucas et al. 2015) or gas-grain reactions induced by cosmic rays (Garrod et al. 2008). In addition, reactions involving CH2OH on interstellar ices have also been proposed to form complex organic molecules (COMs) as glycolaldehyde (HOCH2CHO) and ethylene glycol (HOCH2CH2OH; Butscher et al. 2015). However, because CH2OH has never been conclusively detected in the ISM – contrary to its isomer methoxy (CH3O; Cernicharo et al. 2012) and closely related formaldehyde (H2 CO; Snyder et al. 1969)and formyl radical (HCO; Snyder et al. 1976) – all models crucially lack molecular abundance for the CH2 OH radical.
The suspected role of the CH2OH radical, not only in the ISM chemistry but also in the Earth’s atmosphere (Seinfeld & Pandis 2016) and industrial environments (Westbrook & Dryer 1979), has motivated several studies despite its high chemical reactivity, inducing a relatively short lifetime. Several electronic and vibrational bands have been assigned using low-resolution matrix and gas-phase spectra, thereby allowing thermodynamic and structural properties to be estimated (Dixon & Norman 1963; Livingston & Zeldes 1966; Dulcey & Hudgens 1983; Johnson & Hudgens 1996; Dyke et al. 1984; Jacox & Milligan 1973). Concurrent to these studies, many theoretical investigations on the radical have been undertaken, providing vibrational frequencies, rotational constants in the ground vibrational state, and a prediction of the potential energy hypersurface (Saebo et al. 1983; Marenich & Boggs 2003; Johnson & Hudgens 1996). The first high-resolution (i.e., rotationally resolved) investigation on the species was reported in 2004 by Feng et al. (2004). Using ro-vibronic spectroscopy, the authors partially resolved the rotational structure within three fundamental vibrational bands: the ν3 (CH symmetric stretch), ν2 (CH asymmetric stretch), and ν1 (OH stretch) bands lying around 3050, 3200, and 3700 cm−1, respectively.Roberts et al. (2013) recorded the first direct ro-vibrational spectrum of CH2 OH using high-resolution infrared spectroscopy in a supersonic expansion leading to the direct observation of  transitions in the ν3 band. Finally, the rotation-tunneling spectrum of CH2OH in the millimeter-wave domain, which is crucial for astronomical searches, was reported in 2017 (Bermudez et al. 2017). This study revealed a tunneling effect that significantly complicates the spectroscopy of the molecule. Shortly after, the ro-vibrational spectroscopy in the symmetric CH-stretch region was revisited and transitions in both tunneling sublevels were reported (Schuder et al. 2017).
It is thus interesting that, while rotation-tunneling transitions of CH2 OH have been observed in the laboratory, the species remains undetected in space. In particular, despite the high number of transitions recorded by Bermudez et al. (2017), those involving the lowest quantum numbers – thus expected to be intense under cold interstellar conditions – remain elusive. In this work, we reinvestigated the rotation-tunneling spectrum with the aim of directly observing the transitions expected to be intense under interstellar conditions. We measured about 180 transitions, thereby allowing a significant refinement of the rotational constants and now enabling confident searches for the radical in the ISM.
2 Methods
2.1 Spectroscopic properties
With an asymmetry parameter κ = (2B − A − C)∕(A − C) = −0.95, where A, B, and C are the rotational constants, the CH2OH radical is an asymmetric rotor close to the prolate limit (κ = −1). Quantum chemical calculations, led by Saebo et al. (1983) for example, point to a nonplanar structure at equilibrium (of C1 symmetry), albeit with a low barrier to planarity. It is well accepted that, in the vibrational ground state, the species behaves as a planar molecule of Cs symmetry (Johnson & Hudgens 1996). Indeed, the inertial defect in v = 0, Δ0 = Ic,0 − Ib,0 − Ia,0 = −0.05527 amu Å2, is very close to zero, indicating that the molecule is planar in this state. The negative sign of Δ0 reflects the existence of low-lying, out-of-plane vibrational modes (Oka 1995). The radical possesses a permanent dipole moment of 0.13 D and 1.6 D (calculated values, Bermudez et al. 2017) along the a- and b-axes of symmetry, respectively. As a reflection of the much lower value of the dipole moment along the a-axis, all rotational transitions observed so far obey b-type selection rules.
Because the hydroxyl H tunnels between two equivalent positions, a tunneling-rotation interaction creates two substates, a symmetric and an antisymmetric one. While these two subtates are often referred to as v = 0+ and v = 0−, in this work we favor the notation vt = 0 and vt = 1 (for the symmetric and antisymmetric substates, respectively) because it allows for a straightforward definition of the ortho (Ka + vt even) and para (Ka + vt odd) rotational levels. Rotational levels within each tunneling state are connected by a-type transitions and those between the tunneling states by b-type transitions. Finally, the observation of ortho and para spin-statistics in the line intensity of the rotational and ro-vibrational spectra indicates that the symmetry of the tunneling substates is C2v, and thus this gives additional evidence of the planarity of the molecule in the ground vibrational state. For further details, Bermudez et al. (2017) provided a description of the internal wave function and statistical weight of the tunneling sublevels.
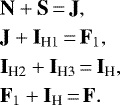
The rotational energy level structure of the hydroxymethyl radical is further complicated by the presence of one unpaired electron (S = 1∕2) and three H atoms of non-zero nuclear spins (IH = 1∕2). The rotational, electron-spin, and nuclear-spin angular momenta are coupled as follows, where the hydroxyl H atom is labeled as H1 and the two methylenic H atoms as H2 and H3 (see Fig. 1):
 (1)
(1)
The electron-spin–rotation coupling causes each rotational level with N > 0 to be split into two fine structure (FS) components (of J quantum number). Each fine structure level is split into two components by the hyperfine structure (HFS) associated with the hydroxyl H1 (F1). For ortho rotational levels, each of these HFS level is further split into three components by the HFS associated with the methylenic H2 and H3 atoms (F), whereas no additional splitting occurs for para levels. Consequently, each energy level of the species is described by a set of seven quantum numbers: N, Ka, Kc, vt, J, F1, F. This relatively complex energy level diagram is illustrated in Fig. 1. The components of the b-type transitions between two rotational levels (![Mathematical equation: $N'_{K_a',K_c'} \xleftarrow[]{}N''_{K_a'',K_c''}$](/articles/aa/full_html/2020/12/aa39071-20/aa39071-20-eq3.png) ) are split into a pattern of four clusters of lines and follow the selection rules ΔJ = J′− J″ = 0 or 1,
) are split into a pattern of four clusters of lines and follow the selection rules ΔJ = J′− J″ = 0 or 1,  = 0 or 1, and ΔF = F′− F″ = 0 or 1. The coupling scheme we choose is governed by the use of the CALPGM suite of programs (Pickett 1991) for our analysis. The hyperfine splitting caused by the methylene H2 and H3 atoms is larger than that of the hydroxyl H1 atom, but the SPFIT and SPCAT programs require the set of equivalent nuclei to be coupled with the remaining angular momenta last. The main effect is that the F1 quantum numbers are less meaningful than if the hydroxyl H1 spin angular momentum were coupled last.
2.2 Experimental setup
The rotation-tunneling transitions of CH2OH were recorded in the 140–330 GHz region using an absorption millimeter-wave spectrometer described in Pirali et al. (2017). The spectrometer consists of a radio-frequency synthesizer, a frequency multiplier chain from Virginia Diodes Inc.,a Schottky diode detector, and a lock-in amplifier. The radiation is injected into a 2 m long Pyrex absorption cell equipped with Teflon windows at both ends. The radical is produced by H-abstraction from methanol using atomic fluorine, itself produced upstream by a microwave discharge (set at 100 W) in a F2 /He mixture (5% dilution). To limit surface reactions of the radical, which would lower its abundance, the absorption cell is covered with a fluorinated wax. The precursor (methanol in this case) and atomic fluorine are injected separately in the cell using two gas inlets. A fast flow, ensured by a roots blower, was mandatory to observe the radical witha sufficient signal-to-noise ratio (S/N). The best signals were obtained for partial pressures of 10 μbar of methanol and 20 μbar of F2 /He. To unambiguously identify transitions arising from open-shell species, a permanent magnet (~ 15 mT) was used forreference measurements by placing it underneath the interaction area of the two gases. The induced Zeeman effect was strong enough that only absorption transitions of close-shell species remain detected in the reference spectra. Since these transitions have the same intensity in the spectra recorded with and without magnet, reference subtraction yields a spectrum on which only transitions arising from open-shell species are visible.
For all measurements, a frequency modulation of 48.2 kHz and a frequency step of 50 kHz were used. Because of the 2f demodulation scheme employed on the detection side, all transitions display a second derivative line shape. In the 140–220 and 220–330 GHz range, the modulation depth was set to 400 and 500 kHz, respectively. As a result of a line-by-line type of measurement, the time constant was set for each scans to maximize the S/N, while maintaining a reasonable acquisition time. Thanks to a relatively stable baseline, long time constants on the order of 500 ms to 2 s were routinely used. For the weakest lines, the measurements were repeated up to 10 times.
Overall,182 transitions were measured with S/N ranging from 5 to 15 and line frequency accuracy from 50 to 200 kHz. Figure 2 shows the prediction of the rotation-tunneling spectrum below 400 GHz using the final set of parameters at room temperature and 10 K. All the most intense transitions at both temperatures have now been measured in the covered spectral region (as indicated by asterisks on Fig. 2).
 |
Fig. 1 Schematic energy level diagram of the CH2OH radical and selected portions of the experimental spectrum displaying the different components of the
r Q0 (10) ( |
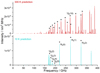 |
Fig. 2 Prediction of the rotation-tunneling spectrum of CH2OH (final fit from this work) in the 150–350 GHz region, at room temperature (in red) and at 10 K (in cyan). Transitions measured in this work are indicated with an asterisk. The strongest transitions at low temperatures that have been measured in this work (at room temperature) are also indicated and labeled using the formalism
|
3 Results and discussion
3.1 Refit of the literature rotation-tunneling data
Pickett’s SPCAT and SPFIT programs (Pickett 1991) were employed for prediction and fitting of the rotational spectrum of CH2 OH. The startingparameters were slightly modified from those presented by Bermudez et al. (2017). First, we employed a Watson’s S reduction of the rotational Hamiltonian because the molecule is rather close to the prolate limit. Then, to minimize correlations, instead of individual A, B, and C, we adjusted the linear combinations A − (B + C)∕2, (B + C)∕2, and (B − C)∕4. Instead of reporting such linear combinations in each tunneling state, we present average values together with the deviation for each substate (indicated by Δ parameters in Table 1, see footnote b). The rotational constants within each tunneling state are given in Table A.1. The fit using individual rotational constants or linear combinations of them are strictly equivalent. Since the initial data set only consisted of transitions with Ka ≤ 1, we kept the off-diagonal quartic centrifugal distortion constant d2 fixed to value derived from the calculated δK value and floated d1 (d1 = −δJ in the A reduction) because (B − C)∕4 and d1 are the main parameters determining the asymmetry splitting in Ka = 1. Because the experimental quartic centrifugal distortion parameters in the vibrational ground state are frequently larger in magnitude than the calculated equilibrium parameters, we increased the ab initio DK value reported in Bermudez et al. (2017) by about 5%, which is slightly less than the change in ΔN between equilibrium and ground-state values in the same work. We did not consider the larger change in ΔNK because of the much larger uncertainty of the experimental value. Finally, we estimated an HK value based on the DK∕(A − (B + C)∕2) ratio with the aim of better predicting the location of transitions involving higher values of Ka and improving the partition function values at higher temperatures.
This revised set of spectroscopic parameters was used to fit the 96 lines published by Bermudez et al. (2017), 11 of which were excluded from the authors fit. We revised the assignment of the line in the vicinity of 270 377.474 MHz. In the original work, this line wasattributed to three HFS components, but omitted from the fit because of the large deviation between the measured and calculated frequencies. A closer look at the prediction revealed that two of the HFS components are close to each other (with a calculated splitting of about 200 kHz), while the third component is lying more than 600 kHz away (which is about the line width at these frequencies). Therefore, it is unlikely that this component contributes appreciably to the measured line position and we decided to include the two close HFS components in the fit (and thus to omit only the third component). To sum up, the initial set oftransitions consists of 87 lines; this set is comprised of 96 transitions assigned less the 11 originally excluded plus 2 added. The resulting set of initial spectroscopic parameters is reported in Table 1.
3.2 Strategy of assignment
As shown by Bermudez et al. (2017), the rotational-tunneling spectrum of the radical is rather complex. In our first series of measurements, some clusters of lines did not appear to be predicted well. We thus suspected that some parameters were not properly constrained in the initial fit. Therefore, we decided to perform systematic measurements within each cluster of rotational transitions. Starting from the transitions reported by Bermudez et al. (2017), we then extended our measurements toward both higher and lower N values. This systematic approach was crucial to well constrain the relatively large number of parameters necessary to fit all measured transitions. It revealed one set of misassignments in the work of Bermudez et al. (2017), namely the rQ0 (7),  ,
,  FS component. The authors assigned frequencies at 227 659.877 and 227 662.665 MHz to the
  and
and  HFS components, respectively. Our investigations revealed that the first frequency should be assigned to the
  component, while the second frequency does not belong to the rotational spectrum of CH2OH in its ground vibrational state according to present prediction. Our model predicted the
  component about 3 MHz lower in frequency than the original assignment, and a line was assigned at 227 656.875 MHz. Once this correction was made, we could omit two electron-spin–rotation centrifugal distortion parameters,
  and
and  , from the fit. In consequence, this assignment correction induced a very large change in the electron-spin–rotation constant ɛaa and additional significant variations in rotational and centrifugal distortion terms A − (B + C)∕2 and DNK, as well as ɛbb and ɛcc.
Spectroscopic parameters (in MHz, unless otherwise noted) of CH2OH determined in the refit of the literature (initial) and from this work (present).
3.3 Inclusion of the new measurements in the fit
Most of the newly measured lines could be assigned and fit straightforwardly. The addition of Q-branch FS components with  and
and  yields a large variation of ΔE (the energy difference between both tunneling sublevels), Δ(B + C), and Δ(B − C); and required the off-diagonal electron-spin–rotation constant
  and Δ(A − (B + C)∕2) to be included in the fit. In addition, we floated d2 but kept DK fixed in the fit because the change in DK was deemed too large (about a quarter of its magnitude). At this stage of the analysis, some of our transition frequencies, mostly with low values of N, still deviated significantly from their calculated positions. This also applied to most of the transitions that were already omitted in Bermudez et al. (2017). We were able to reproduce all these transitions satisfactorily by adjusting the off-diagonal coupling parameter (ɛab + ɛba)∕2 in the fit. It is important to point out that the C2v symmetry of the tunneling substates rules out that this parameter acts within the tunneling states. Instead, it acts as an interaction parameter between the tunneling states. The same applies to the off-diagonal anisotropic hyperfine interaction constant for the hydroxyl H, Tab(H1).
Overall,we were able to reproduce 276 lines in the final fit (94 from Bermudez et al. 2017 and 182 from this work) with N and Ka ranging from 0 to 13 and from 0 to 1, respectively, by adjusting 21 parameters while keeping 5 fixed. Despite partial overlap between both datasets, all transition frequencies from Bermudez et al. (2017) (with the exception of two HFS components mentioned above) and from our new measurements were kept in the final fit because transition frequencies from both sets (i) have similar uncertainties and (ii) constitute independent pieces of information. The final set of spectroscopic parameters is reported in Table 1; the derived rotational constants within each tunneling sublevel are reported in Table A.1. The root mean square (rms) of the fit is 81 kHz and the standard deviation is 0.95, indicating that the transitions are reproduced within their experimental accuracy (Tables B.1 and B.2).
The greatly extended line list, in particular transitions involving low values of N, enabled the determination of new Hamiltonian parameters and the improvement of several other parameters, notably the HFS parameters. Overall, this enabled an important refinement of the model parameters set. While some parameters are fairly close to those previously determined, several undergo significant variations that are well beyond the previously expected uncertainties. For instance, the energy difference between the two tunneling states ΔE is shifted by 20 MHz; A −(B + C)∕2 by about 5 MHz; and Δ(B − C) by more than a factor 5. The use of Δ(A − (B + C)∕2) in the fit and its strong correlation with ΔE led to an increase of the uncertainty of the latter compared to the initial fit. These strong variations are likely a reflection of the two identified misassignments and the more systematic measurements of lines within each rotational clusters. A few parameters warrant further discussion. The signs of the off-diagonal anisotropic hyperfine interaction constants for the hydroxyl H1, Tab (H1), and of (ɛab + ɛba)∕2, cannot be determined through the fits, but the relative signs matter. Trial fits showed that their signs need to be opposite and that the value of Tab (H1) was rather uncertain: 15.0 ± 5.0 MHz. Therefore, we kept the value of Tab(H1) fixed to that calculated in Bermudez et al. (2017), i.e., 17.8 MHz. The off-diagonal anisotropic hyperfine interaction parameters of the two methylenic hydrogens nuclei, Tab(H), act within each tunneling state, and their signs are opposite because of the geometry of the molecule [Tab (H2) = − Tab(H3)]. Several of the HFS parameters associated with the hydroxyl H1 atom and, to a lesser extent, to the methylenic H atoms were kept fixed in the fit. When fitted, the Tab(H) parameter took a value of − 62 ± 11 MHz, which is a factor two away from the calculated value reported in Bermudez et al. (2017), while the rms error remained unchanged. In consequence, we decided to keep Tab(H) fixed to the calculated value. As can be seen in Table 1, the accuracies of the HFS parameters associated with the hydroxyl H1 remain limited. When floating, Tab (H1) changed its values to 17.3 ± 4.4 MHz while the rms error only changes very slightly, from 0.95 to 0.94. Consequently, we decided to keep this parameter fixed in favor of a more constrained fit. However, we can state that the hydroxyl H1 HFS parameters are almost certainly lower in magnitude than the value to which they are currently kept fixed. The initial and final experimental datasets, parameter, and fit files along with additional auxiliary files are available in the fitting spectra sections1 of the Cologne Database for Molecular Spectroscopy, CDMS (Endres et al. 2016); a new calculation of the rotational spectrum of CH2OH is available in the catalog section2 of the CDMS.
3.4 Astronomical implications
The position of many clusters of lines that were not previously measured by Bermudez et al. (2017) differs considerably from our initial prediction, in particular those involving the lowest quantum numbers and that should be intense at low temperatures. For example, we observed a significant shift of the r R0 (2) transition components located around 322 GHz (see Fig. 3). Using the initial set of spectroscopic constants, these lines were predicted about 10 MHz below their actual positions. Such a shift is much larger than the width of astronomical lines and may thus explain why the species has remained undetected in the ISM so far. Similar comments can be made for most of the astronomically relevant transitions. Tables B.1 and B.2 summarize the strongest r Q0 and r R0 transitions at 10 K below 400 GHz, and a comparison of the current prediction with the observed frequencies. The current model nicely reproduces all observed rotational transition clusters as can also be seen in Fig. 4.
While we measured transitions in most clusters of the astrophysically relevant lines below 400 GHz, our sensitivity prevented us from measuring every single one of these transitions. Thus, we cannot exclude some frequency shift from the prediction. In particular, the lowest energy rotational transition rQ0(1) remains elusive. Its clusters are now expected to lie between 8 and 37 MHz away from the initial prediction (depending on each cluster). The quality of the present calculated transition frequencies, for such lines involving low values of N and Ka ≤ 1, probably depends mostly on the uncertainties of the HFS parameters, which are currently kept fixed in the final fit. To estimate such uncertainties in the prediction, we performed several test fits by subsequently floating each HFS parameter. By far, the largest effect was observed for aF(H1), yielding deviations of the predicted frequencies exceeding several times the calculated uncertainties (of our finalfit) for many of the HFS transitions. However, all those frequency shifts are within ~1.7 MHz and only marginally affect the strongest HFS components. Consequently, the uncertainties of HFS parameters may lead to frequency shifts of the non-observed lines that are not negligible but should not prevent the identification of the molecule in the ISM by radio astronomical means. We note that the deviation induced by the uncertainties of the other HFS parameters [Taa (H1), Tab (H) and Tab(H1)] is much smaller (below 0.32 MHz) and within the calculated uncertainties on the frequencies.
Aside from the effects that may be caused by the uncertainties related to some HFS parameters, the CH2OH rotational spectrum should be well constrained for transitions involving low N and Ka ≤ 1. These transitions are the most important ones for astronomical searches of the molecule in dark or translucent molecular clouds. Nevertheless, from a spectroscopic point of view, to further constrain the fit it may be useful to investigate rotational transitions involving higher values of Ka. The  and
and  Q-type transitions lie above 410 and 630 GHz, respectively. Such studies should also enable or improve the determination of some spectroscopic parameters, such as DK, d2, Δ(A − (B + C)∕2), Δ(B + C), and Δ(B − C). These investigations may also reveal the potential need for additional parameters, in particular quartic spin-distortion terms, while improving the accuracies of the HFS parameters, and may even require the use of an inversion-torsion-rotation Hamiltonian (Paulse et al. 1996). Finally, these transitions may as well be observable in warm (e.g., at a couple hundred K) astronomical sources.
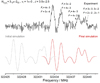 |
Fig. 3 Overview of one cluster of lines in the rR0(2) rotational transition of CH2OH. The black trace corresponds to the experimental survey and it is compared with 300 K spectral simulations performed using the initial (refit, in gray) and final (in red) set of parameters. The presented experimental spectrum results from the subtraction of two recordings, without and with a permanent magnet, so that only transitions arising from open-shell species are visible. The full width at half maximum of both spectral simulations were chosen to reproduce the experimental signal at best. |
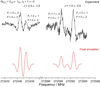 |
Fig. 4 Overview of two clusters of lines in the rR0(1) rotational transition of CH2OH. The black trace corresponds to the experimental survey and is compared with 300 K spectral simulations (in red) performed using the final set of parameters. See Fig. 3 for further information on experimental and simulated traces. This r R0 (1) is the most intense transition expected at 10 K below 400 GHz (see Fig. 2). The relative intensity for HFS components within a rotational transitions are similar at 300 K and 10 K. |
4 Conclusions
In this work, we reported a new investigation of the rotation-tunneling spectrum of the CH2OH radical following the work of Bermudez et al. (2017). We measured 182 Q- and R-type transitions in the millimeter-wave spectral region (140–330 GHz) involving values of N″ and  ranging from 0 to 13 and 0 to 1, respectively. In particular, we measured, for the first time, the r Q0 (2) – r Q0 (4) and r R0 (0) – r R0 (3) transitions. These lines are of direct astrophysical relevance, that is, expected to be intense in cold environments. The new measurements, associated with the work presented in Bermudez et al. (2017), allowed us to revise the set of spectroscopic parameters of CH2OH. Spectral predictions based on these constants are expected to be reliable below 330 GHz from 10 to 300 K, thus enabling confident interstellar searches for the radical in cold to warm environments.
Acknowledgements
O.C. thanks Sabine Morisset and Nathalie Rougeau for useful discussions concerning theoretical models involving the radical. This project received funding from the Région Ile-de-France, through DIM-ACAV+, from the Agence Nationale de la Recherche (ANR-19-CE30-0017-01), from the “Investissements d’Avenir” LabEx PALM (ANR-10-LABX-0039-PALM), and from the Programme National “Physique et Chimie du Milieu Interstellaire” (PCMI) of CNRS/INSU with INC/INP co-funded by CEA and CNES.
Appendix A Rotational constants values
Rotational constants (in MHz) of CH2OH determined in the refit of the literature (initial) and from this work (present).
Appendix B Selected astrophysically relevant transitions
The rotational constants in each tunneling substate can be derived from the parameters presented in Table 1; these values are reported in Table A.1.
Selected astrophysically relevant  transitions calculated at 10 K below 400 GHz (intensity, expressed in log(Icalc), and frequency, fcalc) and comparison with the present measurements (exp).
Selected astrophysically relevant  transitions calculated at 10 K below 400 GHz (intensity, expressed in log(Icalc), and frequency, fcalc) and comparison with the present measurements (exp).
References
- Acharyya, K., Herbst, E., Caravan, R., et al. 2015, Mol. Phys., 113, 2243 [NASA ADS] [CrossRef] [Google Scholar]
- Balucani, N., Ceccarelli, C., & Taquet, V. 2015, MNRAS, 449, L16 [Google Scholar]
- Bermudez, C., Bailleux, S., & Cernicharo, J. 2017, A&A, A9, A598 [Google Scholar]
- Bertin, M., Romanzin, C., Doronin, M., et al. 2016, ApJ, 817, L12 [NASA ADS] [CrossRef] [Google Scholar]
- Butscher, T., Duvernay, F., Theule, P., et al. 2015, MNRAS, 453, 1587 [NASA ADS] [CrossRef] [Google Scholar]
- Cernicharo, J., Marcelin, N., Roueff, E., et al. 2012, ApJ, 759, L43 [NASA ADS] [CrossRef] [Google Scholar]
- Dixon, W. T., & Norman, R. O. C. 1963, J. Chem. Soc., 1963, 3119 [CrossRef] [Google Scholar]
- Dulcey, C. S., & Hudgens, J. W. 1983, J. Phys. Chem., 87, 2296 [CrossRef] [Google Scholar]
- Dyke, J., Ellis, A., Jonathan, N., Keddar, N., & Morris, A. 1984, Chem. Phys. Lett., 111, 207 [CrossRef] [Google Scholar]
- Endres, C. P., Schlemmer, S., Schilke, P., Stutzki, J., & Müller, H. S. P. 2016, J. Mol. Spectr., 327, 95 [NASA ADS] [CrossRef] [Google Scholar]
- Feng, L., Wei, J., & Reisler, H. 2004, J. Phys. Chem. A, 108, 7903 [CrossRef] [Google Scholar]
- Garrod, R. T., Widicus Weaver, S. L., & Herbst, E. 2008, ApJ, 682, 283 [NASA ADS] [CrossRef] [Google Scholar]
- Hama, T., & Watanabe, N. 2013, Chem. Rev., 113, 8783 [CrossRef] [Google Scholar]
- Jacox, M. E., & Milligan, D. E. 1973, J. Mol. Spectr., 47, 148 [NASA ADS] [CrossRef] [Google Scholar]
- Johnson, R. D., & Hudgens, J. W. 1996, J. Phys. Chem., 100, 19874 [CrossRef] [Google Scholar]
- Livingston, R., & Zeldes, H. 1966, J. Chem. Phys., 44, 1245 [CrossRef] [Google Scholar]
- Lucas, M., Liu, Y., Bryant, R., Minor, J., & Zhang, J. 2015, Chem. Phys. Lett., 619, 18 [CrossRef] [Google Scholar]
- Marenich, A. V., & Boggs, J. E. 2003, J. Chem. Phys., 119, 10105 [CrossRef] [Google Scholar]
- Morisset, S., Rougeau, N., & Teillet-Billy, D. 2019, Mol. Astrophys., 14, 1 [NASA ADS] [CrossRef] [Google Scholar]
- Öberg, K. I., Garrod, R. T., van Dishoeck, E. F., & Linnartz, H. 2009, A&A, 504, 891 [NASA ADS] [CrossRef] [EDP Sciences] [Google Scholar]
- Oka, T. 1995, J. Mol. Struct., 352-353, 225 [NASA ADS] [CrossRef] [Google Scholar]
- Paulse, C. D., Coudert, L. H., Goyette, T. M., et al. 1996, J. Mol. Spectr., 177, 9 [CrossRef] [Google Scholar]
- Pickett, H. M. 1991, J. Mol. Spectr., 148, 371 [NASA ADS] [CrossRef] [Google Scholar]
- Pirali, O., Goubet, M., Boudon, V., et al. 2017, J. Mol. Spectr., 338, 6 [CrossRef] [Google Scholar]
- Roberts, M. A., Sharp-Williams, E. N., & Nesbitt, D. J. 2013, J. Phys. Chem. A, 117, 7042 [CrossRef] [Google Scholar]
- Saebo, S., Radom, L., & Schaefer, H. F. 1983, J. Chem. Phys., 78, 845 [NASA ADS] [CrossRef] [Google Scholar]
- Schuder, M. D., Wang, F., Chang, C.-H., & Nesbitt, D. J. 2017, J. Chem. Phys., 146, 194307 [CrossRef] [Google Scholar]
- Seinfeld, J., & Pandis, S. 2016, Atmospheric Chemistry and Physics: From Air Pollution to Climate Change (New Jersey: John Wiley & Sons) [Google Scholar]
- Snyder, L. E., Buhl, D., Zuckerman, B., & Palmer, P. 1969, Phys. Rev. Lett., 22, 679 [NASA ADS] [CrossRef] [Google Scholar]
- Snyder, L. E., Hollis, J. M., & Ulich, B. L. 1976, ApJ, 208, L91 [NASA ADS] [CrossRef] [Google Scholar]
- Wakelam, V., Loison, J.-C., Mereau, R., & Ruaud, M. 2017, Mol. Astrophys., 6, 22 [NASA ADS] [CrossRef] [EDP Sciences] [Google Scholar]
- Watanabe, N.,& Kouchi, A. 2002, ApJ, 571, L173 [NASA ADS] [CrossRef] [Google Scholar]
- Westbrook, C. K., & Dryer, F. 1979, Combust. Sci. Technol., 20, 125 [CrossRef] [Google Scholar]
All Tables
Spectroscopic parameters (in MHz, unless otherwise noted) of CH2OH determined in the refit of the literature (initial) and from this work (present).
Rotational constants (in MHz) of CH2OH determined in the refit of the literature (initial) and from this work (present).
Selected astrophysically relevant transitions calculated at 10 K below 400 GHz (intensity, expressed in log(Icalc), and frequency, fcalc) and comparison with the present measurements (exp).
Selected astrophysically relevant transitions calculated at 10 K below 400 GHz (intensity, expressed in log(Icalc), and frequency, fcalc) and comparison with the present measurements (exp).
All Figures
|
Fig. 1 Schematic energy level diagram of the CH2OH radical and selected portions of the experimental spectrum displaying the different components of the
r Q0 (10) ( |
| In the text | |
|
Fig. 2 Prediction of the rotation-tunneling spectrum of CH2OH (final fit from this work) in the 150–350 GHz region, at room temperature (in red) and at 10 K (in cyan). Transitions measured in this work are indicated with an asterisk. The strongest transitions at low temperatures that have been measured in this work (at room temperature) are also indicated and labeled using the formalism
|
| In the text | |
|
Fig. 3 Overview of one cluster of lines in the rR0(2) rotational transition of CH2OH. The black trace corresponds to the experimental survey and it is compared with 300 K spectral simulations performed using the initial (refit, in gray) and final (in red) set of parameters. The presented experimental spectrum results from the subtraction of two recordings, without and with a permanent magnet, so that only transitions arising from open-shell species are visible. The full width at half maximum of both spectral simulations were chosen to reproduce the experimental signal at best. |
| In the text | |
|
Fig. 4 Overview of two clusters of lines in the rR0(1) rotational transition of CH2OH. The black trace corresponds to the experimental survey and is compared with 300 K spectral simulations (in red) performed using the final set of parameters. See Fig. 3 for further information on experimental and simulated traces. This r R0 (1) is the most intense transition expected at 10 K below 400 GHz (see Fig. 2). The relative intensity for HFS components within a rotational transitions are similar at 300 K and 10 K. |
| In the text | |
Current usage metrics show cumulative count of Article Views (full-text article views including HTML views, PDF and ePub downloads, according to the available data) and Abstracts Views on Vision4Press platform.
Data correspond to usage on the plateform after 2015. The current usage metrics is available 48-96 hours after online publication and is updated daily on week days.
Initial download of the metrics may take a while.