Fig. 3
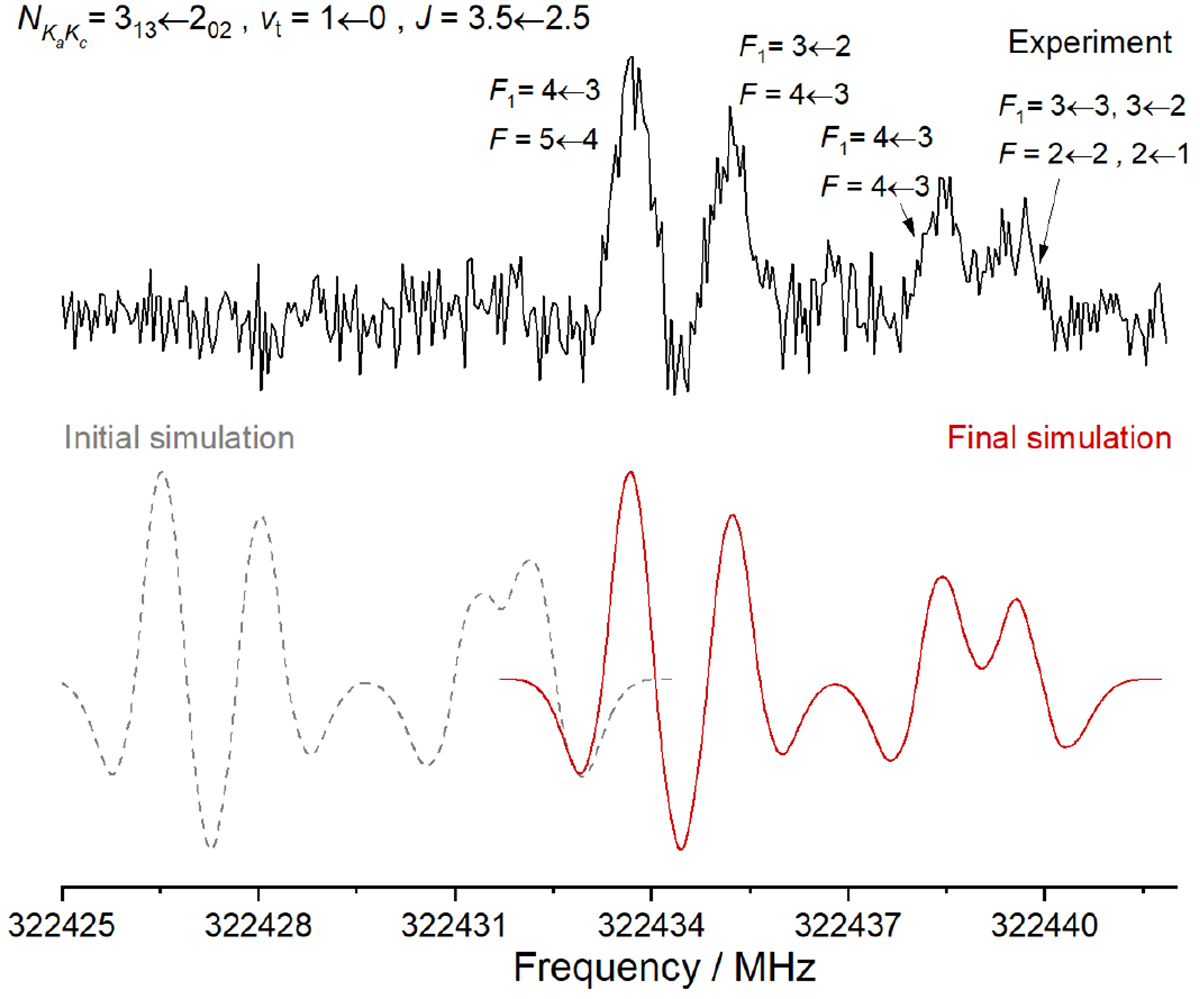
Overview of one cluster of lines in the rR0(2) rotational transition of CH2OH. The black trace corresponds to the experimental survey and it is compared with 300 K spectral simulations performed using the initial (refit, in gray) and final (in red) set of parameters. The presented experimental spectrum results from the subtraction of two recordings, without and with a permanent magnet, so that only transitions arising from open-shell species are visible. The full width at half maximum of both spectral simulations were chosen to reproduce the experimental signal at best.
Current usage metrics show cumulative count of Article Views (full-text article views including HTML views, PDF and ePub downloads, according to the available data) and Abstracts Views on Vision4Press platform.
Data correspond to usage on the plateform after 2015. The current usage metrics is available 48-96 hours after online publication and is updated daily on week days.
Initial download of the metrics may take a while.