| Issue |
A&A
Volume 644, December 2020
|
|
|---|---|---|
| Article Number | A135 | |
| Number of page(s) | 10 | |
| Section | Stellar structure and evolution | |
| DOI | https://doi.org/10.1051/0004-6361/202037607 | |
| Published online | 11 December 2020 | |
Disc light variability in the FUor star V646 Puppis as observed by TESS and from the ground⋆
1
Mount Suhora Observatory, Krakow Pedagogical University, ul. Podchorazych 2, 30-084 Krakow, Poland
e-mail: This email address is being protected from spambots. You need JavaScript enabled to view it.
2
Konkoly Observatory, Research Centre for Astronomy and Earth Sciences, Konkoly-Thege Miklós út 15-17, 1121 Budapest, Hungary
3
Astronomical Observatory, Jagiellonian University, ul. Orla 171, 30-244 Krakow, Poland
Received:
28
January
2020
Accepted:
22
September
2020
Abstract
Context. We investigate small-scale light variations in V646 Pup occurring on timescales of days, weeks, and years.
Aims. We aim to investigate whether this variability is similar to that observed in FU Ori.
Methods. We observed V646 Pup on six occasions at the SAAO and CTIO between 2013 and 2018 with Johnson and Sloan filters, typically using a one-day cadence maintained for two to four weeks. We also utilised the public-domain 1512-day-long ASAS-SN light curve and TESS photometry obtained in 2019 over 24.1 days with a 30 min cadence. New SAAO low-resolution spectra assist in updating major disc parameters, while the archival high-resolution Keck spectra are used to search for temporal changes in the disc rotational profiles.
Results. The ground-based observations confirm the constantly decreasing brightness of V646 Pup at the rate of 0.018 mag yr−1. Precise i-band sensitive TESS data show that the slight, 0.005−0.01 mag, light variations imposed on this general trend do consist of a few independent wave trains of an apparently time-coherent nature. Assuming that this is typical situation, based on an analysis of colour–magnitude diagrams obtained for earlier epochs, we were able to make a preliminarily inference that the bulk of the light changes observed could be due to the rotation of disc photosphere inhomogeneities, arising between 10–12 R⊙ from the star. We do not exclude the possibility that these inhomogeneities could also manifest themselves in the rotational profiles of the disc, as obtained from the high-resolution spectra. Assuming Keplerian rotation of these inhomogeneities, we give a preliminary determination of the stellar mass at 0.7–0.9 M⊙.
Conclusions. Over certain weeks, at least, V646 Pup has shown time-coherent light variability pattern(s) that could be explained by the rotation of an inhomogeneous disc photosphere. These preliminary results are similar to those better established for FU Ori, which suggests a common driving mechanism(s).
Key words: accretion, accretion disks / stars: formation / stars: pre-main sequence / stars: individual: V646 Puppis / protoplanetary disks
Tables A.1–A.8 are only available at the CDS via anonymous ftp to cdsarc.u-strasbg.fr (130.79.128.5) or via http://cdsarc.u-strasbg.fr/viz-bin/cat/J/A+A/644/A135
© ESO 2020
1. Introduction
V646 Puppis (BBW 76) is special among FU Ori-type stars (FUors, Herbig 1977) as it has proven to be the twin of FU Orionis following a study by Eislöffel et al. (1990) and Reipurth et al. (2002). The authors stated that the light outburst of V646 Pup apparently occurred in the 19th century, well before the photographic plates routinely came into use. Its spectrum exhibits numerous similarities with that of FU Ori, including the intensity of the major absorption lines, spectral variation from F5-8 I through G0-G5-I in the visual part to K-M I in the near-infrared, as well as the spectrum slope and likely the same reddening; in addition, it exhibits only small temporal variations in the shape of sodium and Hα lines. Zhu et al. (2008) concluded that both FU Ori and V646 Pup have highly depleted or absent infalling envelopes, which implies that the bulk of the observed visual radiation does emerge directly from their inner discs.
Following the indirect findings of Kenyon et al. (2000), we directly investigated the temporal and spectral properties of the small-scale light changes in FU Ori using MOST satellite (Siwak et al. 2013, 2018b). We demonstrated that the light curve of FU Ori, when collected for a sufficiently long time, can be split into particular segments, each characterised by a different variability pattern and quasi-period. To pinpoint mechanisms leading to this diversity, we compared the 2013–2014 ground-based and the synthetic colour–magnitude diagrams prepared specifically for the distinct segments. We found that the long-periodic family of quasi-periods could be explained by revolution and related changes in visibility of disc inhomogeneities localised at ∼15–20 R⊙ from the star. Furthermore, we obtained that hot spots or unstable hot accretion tongues could potentially explain short-term (1–2 d) variability that is visible for over only one week, as the amplitude of light variations in U-filter was then observed to be twice as large as in BVRcIc filters.
Encouraged by these results, we decided to initiate a similar study for V646 Pup as part of the continuation of our earlier work. To accomplish this goal, first we used a vacant time prior to observations of our primary targets at the South African Astronomical Observatory (SAAO) and Cerro Tololo Inter-American Observatory (CTIO) to check if V646 Pup shows any significant light variations occurring on the timescales of days and weeks. We also utilised precise observations obtained in 2019 by the Transiting Exoplanet Survey Satellite (TESS).
We describe the above and also the supplementary public-domain high-resolution Keck/HIRES spectroscopic and photometric All-Sky Automated Survey for Supernovae (ASAS-SN) observations in Sect. 2. Results of the data analysis and their immediate discussion are presented in Sect. 3. We summarise our main findings in Sect. 4.
2. Observations
2.1. Ground-based observations
Photometric observations of V646 Pup with a cadence of one day were obtained on six occasions between December 2013 and May 2018, prior to observations of primary targets investigated by Siwak et al. (2018a,b), whose papers contain detailed information regarding the data acquisition and reduction, including corrections on differential and colour extintion terms. Here, we only show log of these observations (Table 1) and obtained light curves (Fig. 1, Tables A.1–A.6).
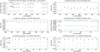 |
Fig. 1. Ground-based light curves of V646 Pup. 2013 SAAO data were standardised to the Johnson-Cousins system. 2016 SAAO data were approximately aligned to the standard Johnson system using TYC 7123-167-1 (Table 2). |
Log of photometric (top) and spectroscopic (bottom) observations utilised in this study.
Standard magnitudes and colour indicies of comparison stars, as measured at the SAAO on 11–12 Jan., 2014 (Siwak et al. 2018b).
2.2. TESS observations
TESS (Ricker et al. 2015) observed V646 Pup during Cycle 1 in Sector 7. The full-field images (FFI) used in this work were gathered between 3:00 UTC on 8 January to 14:00 UTC on 1 February 2019, with the cadence of 30 min. The total monitoring time was 24.44 days, but the run was paused after the first satellite orbit for 2.08 day. A standard aperture photometry of calibrated FFI was carried out using our IDL scripts utilising DAOPHOT (Stetson 1987) procedures. Aperture of the 3 pix (63 arcsec) size was used for the stellar flux extraction, while the sky level was calculated from the annuli between 5 and 8 pixels (84–168 arcsec).
In order to prepare the light curve for scientific analysis, first we removed 34 data points obtained at the beginning of each satellite orbit – 16 in the first and 18 in the second – which were heavily contaminated by scattered Earth light. After this operation, the total run length dropped to 24.1 d and the break in the data acquisition increased to 2.15 d (Fig. 2a). Although the point-spread function of V646 Pup is apparently free of blending, we noticed a star-sky brightness correlation, which was removed by a simple linear fit (Fig. 2b). Finally, we also removed the long-term trend visible in these data by fourth-order polynomial fit; the result is shown in Fig. 2c (Table A7). We show these results in the flux units normalised to unity at the mean star brightness level, while the time is Barycentric TESS Julian Day (BTJD), which is a Julian day minus 2 457 000, corrected to the arrival times at the barycentre of the Solar System.
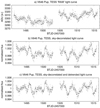 |
Fig. 2. “RAW”, sky-decorrelated and detrended light curve of V646 Pup obtained by TESS in 2019. |
2.3. ASAS-SN observations
In order to examine variability occuring on timescales of months and years, we used 1856 ASAS-SN photometric data points obtained in V- and g′-filters between HJD = 2457420.6652−2458385.8586 and HJD = 2458283.4527−2458932.2978, respectively. Details of the data acquisition, reduction, and calibration to the standard Johnson and Sloan systems can be found in Shappee et al. (2014) and Kochanek et al. (2017). Due to little brightness changes of V646 Pup, we formed 594 nightly-averages from usually three or four individual data points gathered over each night. Their typical (median) error (standard devation) is 0.014 (0.001–0.049) and 0.016 mag (0.001–0.096 mag), while the typical sampling is two and one day for the V- and g′-filter, respectively. The values listed in the parentheses denote the full range of errors associated with respective filters.
2.4. Spectroscopic observations
Over three nights in March, 2017, we obtained several low-resolution spectra of V646 Pup using the Spectrograph Upgrade Newly Improved Cassegrain (SpUpNIC), mounted on the 1.9-m Radcliffe telescope at the SAAO (Crause et al. 2016). Gratings 7 and 6 were used to cover the wavelength ranges from 3498 to 9245 Å and 3904 to 6650 Å with formal resolutions of 2.8 and 1.35 Å pix−1, respectively. Two spectrophotometric standard stars, LTT 2415 and LTT 3864, were observed immediately after V646 Pup through the same slit. The spectra were reduced on bias and flatfield, extracted, and then wavelength- and flux-calibrated (±8%) within the IRAF package (Table A8).
We also requested the RAW spectra Keck archive, gathered for V646 Pup between 1998–2011 by HIRES (Vogt et al. 1994). Each season, the data were obtained in different spectral regions and with different spectral resolutions, that is, 45 000 in 1998 and 2000, and 34 000 in 2011. We routinely processed these spectra using ccdproc and echelle tasks within the IRAF package.
3. Results of the data analysis
3.1. Variability seen from the ground
Archival (Reipurth et al. 2002) and the new SAAO and ASAS-SN V-filter data confirm the long-term trend of the disc light decrease (Fig. 3a). Monitoring extended to 35 years allows us to refine the historical value of 0.023 mag yr−1 (Reipurth et al. 2002) to 0.018 mag yr−1.
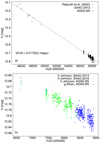 |
Fig. 3. Long-term brightness evolution of V646 Pup in V-filter only (panel a) and brightness evolution in 2013–2020 (panel b). |
We also performed a Fourier analysis to search for possible quasi-periodic oscillations (QPOs) in the recently gathered V and g′-filter standardised data (the last one were combined with the V-filter data by means of Eq. (23) in Fukugita et al. 1996). This timeseries spans 2293 days and was obtained with one to two day cadence, except for the seasonal breaks. First, we removed the overall trend in magnitudes (Fig. 3b) by a second-order polynomial fit and then transformed the obtained “delta series” to flux units normalised to unity at the mean brightness level. We did not find any significant peaks other than those related to the breaks in the data acquisition. The mean standard errors of the amplitudes were calculated with bootstrap sampling technique (Rucinski et al. 2008). Although the power spectrum (Fig. 4a) may appear to show a white-noise character, this is a false result that is due to the small range of observed light variations, which are mostly hidden in the Poisson noise that dominates in the ground-based data.
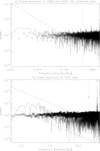 |
Fig. 4. Power spectra (solid lines) in log-log scale of combined V and g-filter SAAO and ASAS-SN data (upper panel) and TESS data (bottom panel). The errors are marked by squares. A red flicker-noise trend, i.e. power ∼ frequency−1, is indicated by dashed lines for comparison. Nyquist frequencies are marked by vertical dotted lines. |
In accordance with the previous finding, no unambiguous QPOs were found during the frequency analysis of separate and combined data sets gathered at the SAAO and CTIO between 2013–2018. Nonetheless, a visual inspection of individual panels in Fig. 1 indicates that marginally significant 7–8 d and 5–6 d QPOs did presumably occur in 2016 and 2017, respectively.
3.2. Variability seen by TESS
Fourier analysis of TESS data obtained typically with the 30 min cadence (Fig. 2c) shows a group of significant peaks between 0.06–0.7 cycles d−1, that is, ∼1.4−5 days (Fig. 4b). Thanks to limited photometric noise, the power spectrum revealed the red-noise character, as in FU Ori. The TESS run length of 24.1 days stands in the way of an investigation of the low-frequency part of the spectrum. Nevertheless, if it is of a rotationally driven nature, these low frequencies are expected to arise at larger distances from the star and should best manifest themselves on infrared wavelenghts. This may explain why no significant long-term light variations superimposed on the general downward trend are seen in ASAS-SN data (Sect. 3.1).
The most important information, however, is recorded in the morphology of the light curve itself: its first part shows a repetitive pattern of light variations (Fig. 5a), which shows a striking similarity to the double-peaked pattern observed in FU Ori in Segment I by MOST (Fig. 5b, see also Siwak et al. 2018b). The phase dispersion minimisation technique indicates at the 4.8 ± 0.2 d period evidence of this light feature in V646 Pup (Fig. 5c) and the phased light curve is shown in Fig. 5d. Its similarity to the event in FU Ori suggests the same driving mechanism: based on the results obtained for FU Ori, we induce that the major peak (at phase 0.6 for V646 Pup) could be owed to the changing visibility of a hot plasma bubble rotating in the disc, while the secondary wide maximum (phase 0.1–0.4) could be caused by the light reflected from the opposite side of the disc. If that is the case, assuming Keplerian rotation and the most likely stellar mass, M of 0.3–0.9 M⊙, the hot plasma bubble would be localised at the distance of 8–12 R⊙, respectively. The lack of simultaneous multi-colour photometry does not allow for an independent confirmation of this value as for FU Ori.
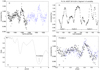 |
Fig. 5. Light curve of V646 Pup gathered during the first TESS orbit, with consecutive variability patterns indicated by different symbols (panel a). It is similar to FU Ori observed by MOST in 2013–2014 (panel b). Phase dispersion minimanisation period search based on θ statistics indicates 4.8 ± 0.2 day period (panel c). Last panel d shows the same data as the first panel, phased with the above value. |
At first glance, variability during the second TESS orbit appears to be time-incoherent. This is also formally confirmed by means of Fourier, autocorrelation, and phase dispersion minimisation techniques. This ambiguity can be solved by means of the wavelet analysis utilising Morlet-6 as the mother function (Fig. 6): the wavelet amplitude-spectrum indicates that variability observed during the second orbit may be (at least in part) treated as a continuation of the double-peaked pattern. The wavelet spectrum also suggests period shortening similar to that observed in FU Ori (Siwak et al. 2013, 2018b). This phenomenon was also seen in ordinary CTTS such as TW Hya (Siwak et al. 2018a) and RU Lup (Siwak et al. 2016), admittedly not directly in the disc light, but via hot spots formed on the stellar photospheres by unstable accretion tongues that directly reflect the temporary inner disc dynamic. Unfortunately, the information loss during the 2.15 d gap prevents any tracking of the evolution of the initial 4.8 d QPO with better confidence: it probably ceased at BTJD = 2458510 as a 3.8–4 d quasi-period. In addition, the wavelet spectrum shows a significant brightening that appeared at BTJD = 2458507 for only 2.7–3 d and disturbed the former double-peaked pattern. The other possibility is that amplitudes of these two peaks were evolving over time, as inferred for Segment I in FU Ori (see Sect. 3.1 in Siwak et al. 2018b).
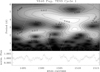 |
Fig. 6. Wavelet spectrum of the detrended (Fig. 2c) light curve. The amplitude is expressed by the grey-scale and solid black lines with values. The white continuous trapezium lines indicate region completely distorted by the break in the data acquisition (although the affected area does likely propagate to longer periods, inside the cone defined by the virtual extension of the trapezium). Edge effects are contained outside the white dashed lines. |
3.3. Colour-index variations
The variety of photometric systems used in this work and frequent lack of standarisation prevents studies of colour index variations occurring on long timescales. For this reason this investigation is limited to variations occurring during separate runs only.
The most obvious correlations are seen in the colour–magnitude diagrams constructed from 2013 SAAO data (Figs. 7a,b). We give the value of the slope a obtained by least squares fits weighted by photometric errors, as well as Sperman’s rS and Kendall’s rK correlation ranks to indicate the goodness of these fits. Interestingly, no QPO is seen in the associated light curves. The 2015 diagram (Fig. 7c) shows a possible correlation, but it is of a small significance. No associated QPO was inferred from the respective light curves either.
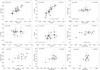 |
Fig. 7. Colour–magnitude diagrams. The only significant trends are seen in 2013, 2016 and 2017. Their errors are in parentheses. |
Although the 2016 V − (B − V) diagram shows a reversed colour index (Fig. 7d), the formal significance of this negative trend is trivial. However, the associated V − (V − I) diagram shows more significant and – interestingly – the positive trend (Fig. 7e). This is reminiscent of the situation observed in colour-magnitude diagrams of FU Ori, prepared for a long-periodic (10–11 d) family of QPOs (Siwak et al. 2018b). Interestingly, only a slightly shorter, possibly 7–8 d QPO, was inferred from the respective light curves for V646 Pup (Sect. 3.1).
The correlations in 2017 data are also significant and are associated with a possible 5–6 d QPO (Sect. 3.1). In contrast, no significant correlations nor QPOs are observed in 2018 (Figs. 7h,i).
3.4. Light synthesis model versus ground-based photometry
Encouraged by the purely phenomenological findings of light variability pattern in V646 Pup that is similar to that observed in FU Ori (Sect. 3.2), and signs of similar trends in colour-magnitude diagrams (Sect. 3.3), we induce that variability of these two discs may be driven by common physical mechanisms. These variations can be preliminarily investigated by means of the disc & star light synthesis model introduced by Siwak et al. (2018b) even despite the fact that the basic assumptions of this methodology – simultaneous space-based coverage to determine accurate values of distinct families of QPOs and ground-based, multi-colour observations to determine spectral properties of these QPOs – is not fulfilled. Instead, we rely on possible values of QPOs inferred from our sparse ground-based data (Sect. 3.1) and we also assume that they occurred over the full two-to-three-week-long monitoring runs.
3.4.1. Update of disc parameters
In these calculations, we start from the approximate disc parameters of V646 Pup derived by Zhu et al. (2008) (consistent with those derived by Green et al. 2006), including inclination (50 deg),  yr−1, and inner disc radius Rinn = 4.6 R⊙, which could be close to the equatorial radius of the bloated star as well, and where Ṁ is the mass accretion rate transferred from the disc onto the star. Using these values, we derive maximum disc temperature Tmax = 7050 K. However, owing to the disc brightness decrease since 1999 based on ΔV = 0.45 mag (Fig. 3a), the flux in visual bands currently amounts to 0.66 of the previous value. Assuming that this is only due to mass transfer rate decrease, we currently estimate
  yr−1 and Tmax = 6340 K. Following the procedure described in Appendix B of Siwak et al. (2018b), we obtain E(B − V) = 0.56 mag and AV = 1.74 mag for RV = 3.1, which is consistent with AV = 1.6 ± 0.2 mag obtained by Connelley & Reipurth (2018).
Assuming Tmax = 6340 K, we obtained a slightly better fit to standardised (in 2013/2014) colour indices: the averaged observed values of (V − Rc) ≈ 0.75 and (V − Ic) ≈ 1.50 mag are reproduced by the model at 0.75 and 1.64 mag, respectively. The model with Tmax = 7050 K results in 0.75 and 1.69 mag, respectively. Although the model was not intended to reproduce the disc spectrum in all its specific details, in Fig. 8, we compare the observed (corrected for respective values of reddening) and the synthetic disc spectra calculated for both values of Tmax. All these spectra were normalised to unity at 4500 Å. The synthetic spectra were also smoothed with a 8 Å boxcar to approximately match the spectrograph resolution. It is evident that the model spectrum with lower disc temperature appears to be a better fit to the observed spectrum, especially in the ultraviolet and the blue parts.
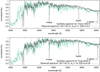 |
Fig. 8. Comparison of spectrum observed on March 12, 2017, with two synthetic spectra. The observed spectrum was dereddened using an appropriate set of AV and E(B − V) values corresponding to the assumed maximum disc temperature Tmax. |
We note that our synthetic spectrum shows metallic lines that are deeper, and Balmer lines that are more shallow, than observed. The first discrepancy is mostly due to unaccounted rotational broadening and the choice of spectral intensities for ordinary supergiant stars, while the second is due to increased absorption by a massive wind, and perhaps even an hot boundary layer that has been unaccounted for. We do not investigate these problems in full as they have secondary effects on light synthesis results in broad-band filters, especially as the current analysis is intended as a guide for further detailed studies. The more serious allegations have to be made with regard to the (inevitable at this stage) staggering assumptions, starting from the uncertainty during the flux-calibration procedure, through a rough estimation of the current MṀ value (apart from the fact that it was earlier estimated using AV = 2.2 mag) to the simple choice of the RV parameter, which leads to a maximum disc temperature uncertainty as large as 500 K. Thus, the results obtained in this work must be treated with a caution until new precise measurements are obtained in the broad spectral range at the same time in order to properly update spectral energy distribution (Abraham et al. 2004; Green et al. 2016) and relevant disc parameters can be established. This may impact the value of Rinn as well, as the new Gaia distance of 1093 pc (Gaia Collaboration 2018) suggests a disc luminosity of 102 L⊙.
3.4.2. Modelling results
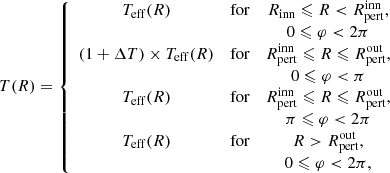
To reproduce the best-defined slopes observed in colour-magnitude diagrams, we used the model with Tmax = 6340 K only. Following the procedure described in Sect. 3.5.2 in Siwak et al. (2018b), we parameterised the disc inhomogeneity using local deviations ΔT from the effective temperature Teff being a function of disc radius R in the case of stationary accretion (Pringle 1981):
![Mathematical equation: $$ \begin{aligned} T_{\rm eff}^{4}(R) = \frac{3GM{\dot{M}}}{8{\pi }{\sigma }R^{3}} \left[1-\left(\frac{R_{\rm inn}}{R}\right)^{\frac{1}{2}}\right], \end{aligned} $$](/articles/aa/full_html/2020/12/aa37607-20/aa37607-20-eq3.gif) (1)
(1)
where G is the universal gravitation constant and σ is the Boltzmann constant, while ΔT ≡ |T(R)−Teff(R)|/Teff(R). This can be written as follows:
 (2)
(2)
where  and
and  define the inner and outer radius of a disc ring, in which the local effective temperatures T(R) deviate by ΔT from these predicted by Eq. (1), while π is an azimuthal angle φ chosen a priori, which determines the azimuthal width of the disc inhomogeneity.
We searched the parameter space manually with a step of 0.01 in ΔT. The same ΔT is always assumed for all filters. A step of ΔR = 1 R⊙ is used to estimate  ,
,  as well as an optimal radial width of the hot spot on the disc
  .
.
Using this procedure, we were unable to reproduce the strong correlations present in 2013 colour-magnitude diagrams assuming disc inhomogeneities parameterised by moderate and large ΔT. We suspect that these light changes could be quasi-periodic (∼1−2 d) for at least a fraction of this run, which remains invisible for us due to the 1 d sampling and limited photometric accuracy. Such strong correlations could then indeed be produced if these variations would occur at the inner boundary of the disc or, perhaps, on the surface of the star, and could be explained by a non-uniform shape of the hot transition region, as considered for a similar one week-long event observed in FU Ori during Segment II in Siwak et al. (2018b). Unfortunately, V646 Pup was too faint for the 50-cm telescope to be observed in blue and ultraviolet band.
Contrary to the above result, the 2016 colour-index variations (i.e. the year we observed signs of V − (B − V) colour reversal) could be explained by the rotation of a hot plasma bubble localised between 15–17 R⊙, parameterised by ΔT = 0.16. Assuming the 7–8 d quasi-period (Sect. 3.1) and Keplerian rotation of the disc, we can estimate the stellar mass at 0.7–0.9 M⊙. We note that clear evidence for colour index reversals was often observed in quiet CTTS’s discs in infrared light (Günther et al. 2014; Wolk et al. 2018 and references in these papers) and explained by significant changes in the inner disc structure.
To reproduce the 2017 colour-magnitude diagrams, we first calibrated our model to Sloan system using Vega magnitudes in AB95 system in Table 7 of Fukugita et al. (1996). Linear limb darkening coefficients for Sloan system were adopted from Table 3 of Claret (2004). We found that these light variations could be owing to the rotation of disc inhomogeneity parameterised by ΔT = 0.15 and localised at 12–15 R⊙. The Keplerian radius of the associated 5–6 d quasi-period (Sect. 3.1) is equal to 13.5 R⊙ for a 0.9 M⊙ star.
This preliminary investigation suggests that longer periods arise at more distant parts of the disc, similarly as in FU Ori (Siwak et al. 2018b). Multiple coordinated observing runs are still necessary to validate this preliminary result.
3.5. Rotational profiles of the disc
The broadening function (BF) method was originally introduced for studies of close binaries in the early 1990s and then significantly improved (Rucinski et al. 2012, and references therein). It determines the Doppler broadening kernel in the convolution equation transforming a sharp-line template into the observed spectrum. As a result, any radial velocity space induced effects are isolated as the kernel of the transformation. The time series of broadening functions can also be used for determination of rotational periods of stars with photospheric inhomogeneities, such as spotted stars as with CTTS (Siwak et al. 2016), and for accretion disc mapping. Given the obvious advantages of the BF over the cross-correlation function (CCF) method previously applied for weak metallic lines studies in other FUors (Hartmann & Kenyon 1985, 1987; Welty et al. 1992; Herbig et al. 2003; Powell et al. 2012), especially with regard to the linearity and increased resolution, we decided to apply it for the first time for a FUor.
In order to calcuate the BFs for V646 Pup, we transformed all spectra to radial velocities binned with the step of Δv = 2.0 km s−1, which is the same for all echelle orders. We extracted the BFs from spectral regions free of broad Balmer and metallic lines affected by strong disc wind features (e.g. a magnezium triplet, see e.g. Herbig et al. 2003). Synthetic spectrum of a supergiant star calculated with the step of 0.01 Å (6250 K, log g = 2.5, Gray 2010) was used as the template during the deconvolution. For BF extraction beyond 6800 Å, we used a similar spectrum from the POLLUX database (Palacios et al. 2010). The BFs were later smoothed with a Gaussian of 1.5 × Δv width to match the effective spectrograph resolution of 7 km s−1. Furthermore, we averaged BFs obtained in 4–12 consecutive echelle orders to get “mean BFs” in five bands, defined as: uv (3611–4077), blue (4067–4559) and green (4596–4845) for 1998 data, and orange (5667–6094), red (6058–6650) and near-infrared (6629–8125 Å) bands for the 2000 and 2012 data. In addition, the 2012 data alone allow us to define the yellow band (4776–5992 Å). We present our obtained results in Figs. 9 and 10. Some bands are unavailable for certain years or they are combined using different number of echelle orders due to different spectrograph setups. The BFs were corrected for relative velocity of the observer with respect to the Sun, but they were intentionally left uncorrected for the mean velocity (33.1 ± 2.5 km s−1 obtained from Gaussian fits to BFs) owing to band- and time-dependent asymmetries.
 |
Fig. 9. Changes of the disc rotational profiles occurring on shorter time-scales. |
 |
Fig. 10. Changes of the disc rotational profiles occurring on longer time-scales. |
In accordance with the results obtained in the past for a few other FUors, V646 Pup does not show purely double-peaked rotational profiles. A structure that most closely resembles such a pattern was only present in 2000 but then became invisible in 2011, even at longer wavelengths. Such a rounded shape for CCF profiles was explained in the past as having been caused by a wind shell, manifesting itself as an excess of absorption (i.e. in CCF or BF intensity) mostly near the blue rotational peak (e.g. Hartmann & Kenyon 1985; Welty et al. 1992, and references in these papers). Herbig et al. (2003) proposed that lack of double-peaked profiles could also be due to a contribution from a fast-rotating bloated central star. In addition, despite our attempts to avoid metallic lines that have obviously been contaminated by the wind, in blue and green continua (1998) we observe a tail extending at least to −180 km s−1 with respect to the profile center, which is of the same nature as that decomposed in detail by Herbig et al. (2003).
The most important result of this analysis is, however, that the BFs show well-defined (i.e. higher than BF errors, determined by scatter in the surrounding continua) excess of intensity on top and on the edges (Figs. 9a,b,c,d). This excess is indicated by short marks in Fig. 9b only, and is present on positive velocities as often as on the negative ones, which suggests that it is more reasonable to attribute it to a rotating disc inhomogeneity; furthermore, we note that it changes its position with respect to the star sometimes (in 1998) within one day. The BFs indicate on wavelength-dependent character of these inhomogeneities: for instance, the 1998 data show largest differences in the uv and blue bands and only small ones in the green. Future coordinated spectroscopic and photometric observations will make it possible to validate this assumption.
Aside from the above, the orange, red, and infrared BFs show evidence of an intensity decrease over the first decade of the 21st century (Figs. 10a–c). To examine whether this is an effect of a weakening outburst (i.e. disc luminosity), we first aligned the continua of all BFs to zero level and integrated the intensities over wavelengths. Integrals calculated from the orange and the red band BFs in December, 2011, are by 1.25 smaller than those obtained in February, 2000. Linear properties of the BF method allow us to translate this value to a 0.22 ± 0.03 mag drop in brightness. This is in accordance with the decline rate obtained from the fit to Johnson-V observations (Fig. 3a), indicating at 0.21 mag, a weakening over the 11.8 years between these observations. It is also noteworthy that the most significant intensity drops are evident in the wings of the BFs, that is, close to the star itself. This finding independently confirms the innermost disc temperature decrease, as shown in Sect. 3.4.1.
4. Summary and conclusions
In this paper, we analyse recent uncoordinated space- and ground-based photometric and spectroscopic observations of V646 Pup in order to detect and offer a preliminarily characterisation of low-amplitude light variations superimposed on the general decreasing trend in brightness. This small-scale variability carries important information about the physical processes taking place in the inner disc and potentially also on the star itself during the stage of episodic accretion.
New V-filter data confirm the gradual light decrease in the disc, which was previously noticed by Reipurth et al. (2002). Assuming that the decline rate 0.0175 mag yr−1 stays the same, the disc will remain in the outburst for another century. Because of the 0.5 mag brightness decrease in visual band over 35 years, we also made an attempt to update several disc-related physical parameters. As a result, we found that the smaller disc temperature (6340 K) and smaller extinction and reddening (AV = 1.74 mag and E(B − V) = 0.56 mag, respectively) better match the flux-calibrated spectrum obtained in 2017.
The power spectrum of V646 Pup computed from the detrended ASAS-SN data does not reveal any significant periods nor quasi-periods. Instead, well-defined quasi-periods are present in the space-based TESS light curve: its first half is dominated by double-peaked light variability pattern, which is surprisingly similar to that observed in the 2013–2014 MOST light curve of FU Ori. We assume that the primary maximum could be caused by changing visibility of a well-defined hot plasma parcel in the course of its rotation around the star, whereas the secondary maximum could be due to reflection effect. Nonetheless, it is premature to conjecture on this possibility with greater certainty due to the lack of simultaneous multi-colour and high-resolution spectroscopic coverage. Similar reservations can be addressed to the results obtained from the modelling of colour-magnitudes diagrams, which, in turn, were received without space-based support that could allow specific values of associated quasi-periods to be determined. Nevertheless, these results are sufficient to support the preliminary conclusion that the inner disc in V646 Pup is Keplerian and the stellar mass is of 0.7–0.9 M⊙. If this is correct, then the double-peaked 4.8 ± 0.2 d variability observed by TESS in 2019 could be caused by rotation of a hot plasma parcel that appeared at 10.5–12 R⊙. Certainly, such a well-defined hot plasma parcel should also manifest its existence in the disc’s rotational profiles. Broadening function profiles calculated from archival Keck data do indicate such possibility.
V646 Pup and FU Ori appear to be ideal among FUors for testing the results obtained from the global three-dimensional magnetohydrodynamical investigation of the mechanism leading to and sustaining episodic accretion for over a century by Zhu et al. (2020). It would be also very instructive to compare the results obtained for these two aging FUors with those for the younger ones (V2493 Cyg – Semkov et al. 2010, V960 Mon – Maehara 2014, Gaia 18dvy – Szegedi-Elek et al. 2020), which can be obtained in future coordinated time-series photometric and high-resolution spectroscopic observations.
Acknowledgments
MS and WO are grateful to the Polish National Science Centre for the grant 2012/05/E/ST9/03915. This project has received funding from the European Research Council (ERC) under the European Union’s Horizon 2020 research and innovation programme under grant agreement No 716155 (SACCRED). This paper includes data collected by the TESS mission. Funding for the TESS mission is provided by the NASA Explorer Program. This study was based on observations made at the Cerro Tololo Inter-American Observatory with the 0.9-m telescope operated by the SMARTS Consortium, and observations made at the South African Astronomical Observatory. Polish participation in SALT is funded by grant No. MNiSW DIR/WK/2016/07. The data presented herein were obtained at the W. M. Keck Observatory, which is operated as a scientific partnership among the California Institute of Technology, the University of California and the National Aeronautics and Space Administration within the programmes ID H22aH and H17aH (George Herbig), C186Hr (Lynne Hillenbrand) and H254H6 (Bo Reipurth). The Observatory was made possible by the generous financial support of the W. M. Keck Foundation. This research has made use of the Keck Observatory Archive (KOA #79971), which is operated by the W. M. Keck Observatory and the NASA Exoplanet Science Institute (NExScI), under contract with the National Aeronautics and Space Administration. This paper made use of NASA’s Astrophysics Data System (ADS) Bibliographic Services, operated by the Smithsonian Astrophysical Observatory under NASA Cooperative Agreement NNX16AC86A. This research was achieved using the POLLUX database (http://pollux.oreme.org) operated at LUPM (Université Montpellier – CNRS, France) with the support of the PNPS and INSU. This research has made use of the SIMBAD database, operated at CDS, Strasbourg, France. We acknowledge Dr. François van Wyk and the entire SAAO staff for their hospitality, and Dr. Jennifer G. Winters for help in efficient start of the CTIO run. Special thanks are also due to an anonymous referee for highly useful suggestions and comments on the previous version of the paper.
References
- Abraham, P., Kospal, A., Csizmadia, S. Z., et al. 2004, A&A, 428, 89 [NASA ADS] [CrossRef] [EDP Sciences] [Google Scholar]
- Claret, A. 2004, A&A, 428, 1001 [NASA ADS] [CrossRef] [EDP Sciences] [Google Scholar]
- Connelley, M. S., & Reipurth, B. 2018, ApJ, 861, 145 [NASA ADS] [CrossRef] [Google Scholar]
- Crause, L. A., Carter, D., Daniels, A., et al. 2016, SPIE, 9908E, 27 [Google Scholar]
- Eislöffel, J., Hessman, F. V., & Mundt, R. 1990, A&A, 232, 70 [NASA ADS] [Google Scholar]
- Fukugita, M., Ichikawa, T., Gunn, J. E., et al. 1996, AJ, 111, 1748 [NASA ADS] [CrossRef] [Google Scholar]
- Gaia Collaboration (Brown, A. G. A., et al.) 2018, A&A, 616, A1 [NASA ADS] [CrossRef] [EDP Sciences] [Google Scholar]
- Gray, R. O. 2010, http://www.appstate.edu/~grayro/spectrum/spectrum.html [Google Scholar]
- Green, J. D., Hartmann, L., Calvet, N., et al. 2006, ApJ, 648, 1099 [NASA ADS] [CrossRef] [Google Scholar]
- Green, J. D., Jones, O. C., Keller, L. D., et al. 2016, ApJ, 832, 4 [NASA ADS] [CrossRef] [Google Scholar]
- Günther, H. M., Cody, A. M., Covey, K. R., et al. 2014, AJ, 148, 122 [NASA ADS] [CrossRef] [Google Scholar]
- Hartmann, L., & Kenyon, S. J. 1985, ApJ, 299, 462 [NASA ADS] [CrossRef] [Google Scholar]
- Hartmann, L., & Kenyon, S. J. 1987, ApJ, 312, 243 [NASA ADS] [CrossRef] [Google Scholar]
- Herbig, G. H. 1977, ApJ, 217, 693 [NASA ADS] [CrossRef] [Google Scholar]
- Herbig, G. H., Petrov, P. P., & Duemmler, R. 2003, ApJ, 595, 384 [NASA ADS] [CrossRef] [Google Scholar]
- Hog, E., Fabricius, C., Makarov, V. V., et al. 2000, A&A, 355, L77 [Google Scholar]
- Kenyon, S. J., Kolotilov, E. A., Ibragimov, M. A., & Mattei, J. A. 2000, ApJ, 531, 1028 [NASA ADS] [CrossRef] [Google Scholar]
- Kochanek, C. S., Shappee, B. J., Stanek, K. Z., et al. 2017, PASP, 129, 4502 [NASA ADS] [CrossRef] [Google Scholar]
- Maehara, H. 2014, ATel, 6770 [Google Scholar]
- Palacios, A., Gebran, M., Josselin, E., et al. 2010, A&A, 516, A13 [NASA ADS] [CrossRef] [EDP Sciences] [Google Scholar]
- Pringle, J. E. 1981, ARA&A, 19, 137 [NASA ADS] [CrossRef] [Google Scholar]
- Powell, S. L., Irwin, M., Bouvier, J., & Clarke, C. J. 2012, MNRAS, 426, 3315 [NASA ADS] [CrossRef] [Google Scholar]
- Reipurth, B., Hartmann, L., Kenyon, S. J., Smette, A., & Bouchet, P. 2002, AJ, 124, 2194 [NASA ADS] [CrossRef] [Google Scholar]
- Ricker, G. R., Winn, J. N., Vanderspek, R., et al. 2015, J. Astron. Telescopes Instrum. Syst., 1, 014003 [Google Scholar]
- Rucinski, S. M. 2012, in From Interacting Binaries to Exoplanets: Essential Modeling Tools, eds. M. Richards, & I. Hubeny (Cambridge: Cambridge Univ. Press), Proc. IAU Symp., 282, 365 [Google Scholar]
- Rucinski, S. M., Matthews, J. M., Kuschnig, R., et al. 2008, MNRAS, 391, 1913 [NASA ADS] [CrossRef] [MathSciNet] [Google Scholar]
- Semkov, E. H., Peneva, S. P., Munari, U., Milani, A., & Valisa, P. 2010, A&A, 523, L3 [NASA ADS] [CrossRef] [EDP Sciences] [Google Scholar]
- Shappee, B. J., Prieto, J. L., Grupe, D., et al. 2014, ApJ, 788, 48 [NASA ADS] [CrossRef] [Google Scholar]
- Siwak, M., Rucinski, S. M., Matthews, J. M., et al. 2013, MNRAS, 432, 194 [Google Scholar]
- Siwak, M., Ogloza, W., Rucinski, S. M., et al. 2016, MNRAS, 456, 3972 [NASA ADS] [CrossRef] [Google Scholar]
- Siwak, M., Ogloza, W., Moffat, A. F. J., et al. 2018a, MNRAS, 478, 758 [NASA ADS] [CrossRef] [Google Scholar]
- Siwak, M., Winiarski, M., Ogloza, W., et al. 2018b, A&A, 618, A79 [CrossRef] [EDP Sciences] [Google Scholar]
- Stetson, P. B. 1987, PASP, 99, 191 [Google Scholar]
- Szegedi-Elek, E., Abraham, P., Wyrzykowski, Ł., et al. 2020, ApJ, 899, 130 [CrossRef] [Google Scholar]
- Vogt, S. S., Allen, S. L., Bigelow, B. C., et al. 1994, in Proc. SPIE Instrumentation in Astronomy VIII, eds. D. L. Crawford, & E. R. Craine, 2198, 362 [NASA ADS] [CrossRef] [Google Scholar]
- Welty, A. D., Storm, S. E., Edwards, S., Kenyon, S. J., & Hartmann, L. 1992, ApJ, 397, 260 [NASA ADS] [CrossRef] [Google Scholar]
- Wolk, S. J., Günther, H. M., Poppenhaeger, K., et al. 2018, AJ, 155, 99 [NASA ADS] [CrossRef] [Google Scholar]
- Zhu, Z., Hartmann, L., Calvet, N., et al. 2008, ApJ, 684, 1281 [NASA ADS] [CrossRef] [Google Scholar]
- Zhu, Z., Jiang, Y.-F., & Stone, J. M. 2020, MNRAS, 495, 3494 [CrossRef] [Google Scholar]
All Tables
Log of photometric (top) and spectroscopic (bottom) observations utilised in this study.
Standard magnitudes and colour indicies of comparison stars, as measured at the SAAO on 11–12 Jan., 2014 (Siwak et al. 2018b).
All Figures
|
Fig. 1. Ground-based light curves of V646 Pup. 2013 SAAO data were standardised to the Johnson-Cousins system. 2016 SAAO data were approximately aligned to the standard Johnson system using TYC 7123-167-1 (Table 2). |
| In the text | |
|
Fig. 2. “RAW”, sky-decorrelated and detrended light curve of V646 Pup obtained by TESS in 2019. |
| In the text | |
|
Fig. 3. Long-term brightness evolution of V646 Pup in V-filter only (panel a) and brightness evolution in 2013–2020 (panel b). |
| In the text | |
|
Fig. 4. Power spectra (solid lines) in log-log scale of combined V and g-filter SAAO and ASAS-SN data (upper panel) and TESS data (bottom panel). The errors are marked by squares. A red flicker-noise trend, i.e. power ∼ frequency−1, is indicated by dashed lines for comparison. Nyquist frequencies are marked by vertical dotted lines. |
| In the text | |
|
Fig. 5. Light curve of V646 Pup gathered during the first TESS orbit, with consecutive variability patterns indicated by different symbols (panel a). It is similar to FU Ori observed by MOST in 2013–2014 (panel b). Phase dispersion minimanisation period search based on θ statistics indicates 4.8 ± 0.2 day period (panel c). Last panel d shows the same data as the first panel, phased with the above value. |
| In the text | |
|
Fig. 6. Wavelet spectrum of the detrended (Fig. 2c) light curve. The amplitude is expressed by the grey-scale and solid black lines with values. The white continuous trapezium lines indicate region completely distorted by the break in the data acquisition (although the affected area does likely propagate to longer periods, inside the cone defined by the virtual extension of the trapezium). Edge effects are contained outside the white dashed lines. |
| In the text | |
|
Fig. 7. Colour–magnitude diagrams. The only significant trends are seen in 2013, 2016 and 2017. Their errors are in parentheses. |
| In the text | |
|
Fig. 8. Comparison of spectrum observed on March 12, 2017, with two synthetic spectra. The observed spectrum was dereddened using an appropriate set of AV and E(B − V) values corresponding to the assumed maximum disc temperature Tmax. |
| In the text | |
|
Fig. 9. Changes of the disc rotational profiles occurring on shorter time-scales. |
| In the text | |
|
Fig. 10. Changes of the disc rotational profiles occurring on longer time-scales. |
| In the text | |
Current usage metrics show cumulative count of Article Views (full-text article views including HTML views, PDF and ePub downloads, according to the available data) and Abstracts Views on Vision4Press platform.
Data correspond to usage on the plateform after 2015. The current usage metrics is available 48-96 hours after online publication and is updated daily on week days.
Initial download of the metrics may take a while.