Fig. 4.
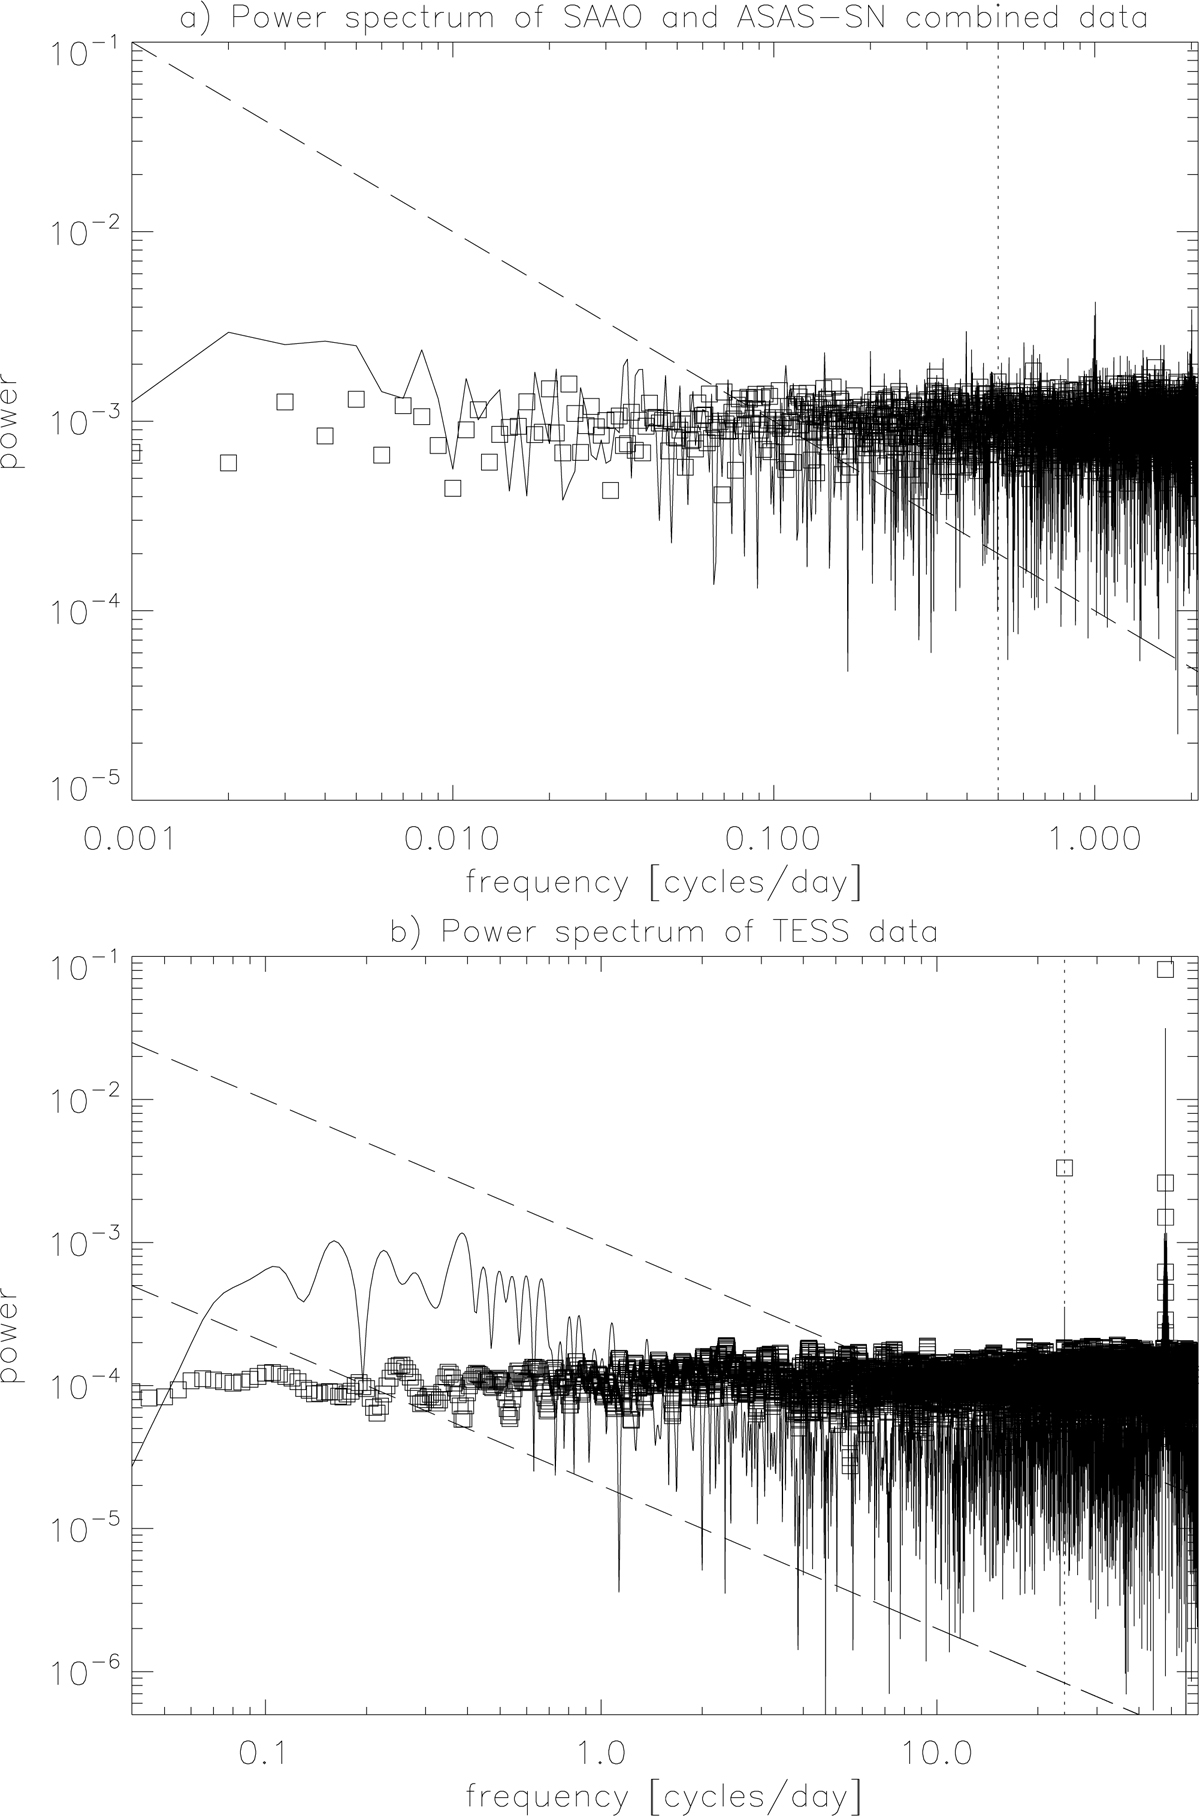
Power spectra (solid lines) in log-log scale of combined V and g-filter SAAO and ASAS-SN data (upper panel) and TESS data (bottom panel). The errors are marked by squares. A red flicker-noise trend, i.e. power ∼ frequency−1, is indicated by dashed lines for comparison. Nyquist frequencies are marked by vertical dotted lines.
Current usage metrics show cumulative count of Article Views (full-text article views including HTML views, PDF and ePub downloads, according to the available data) and Abstracts Views on Vision4Press platform.
Data correspond to usage on the plateform after 2015. The current usage metrics is available 48-96 hours after online publication and is updated daily on week days.
Initial download of the metrics may take a while.