Fig. 6.
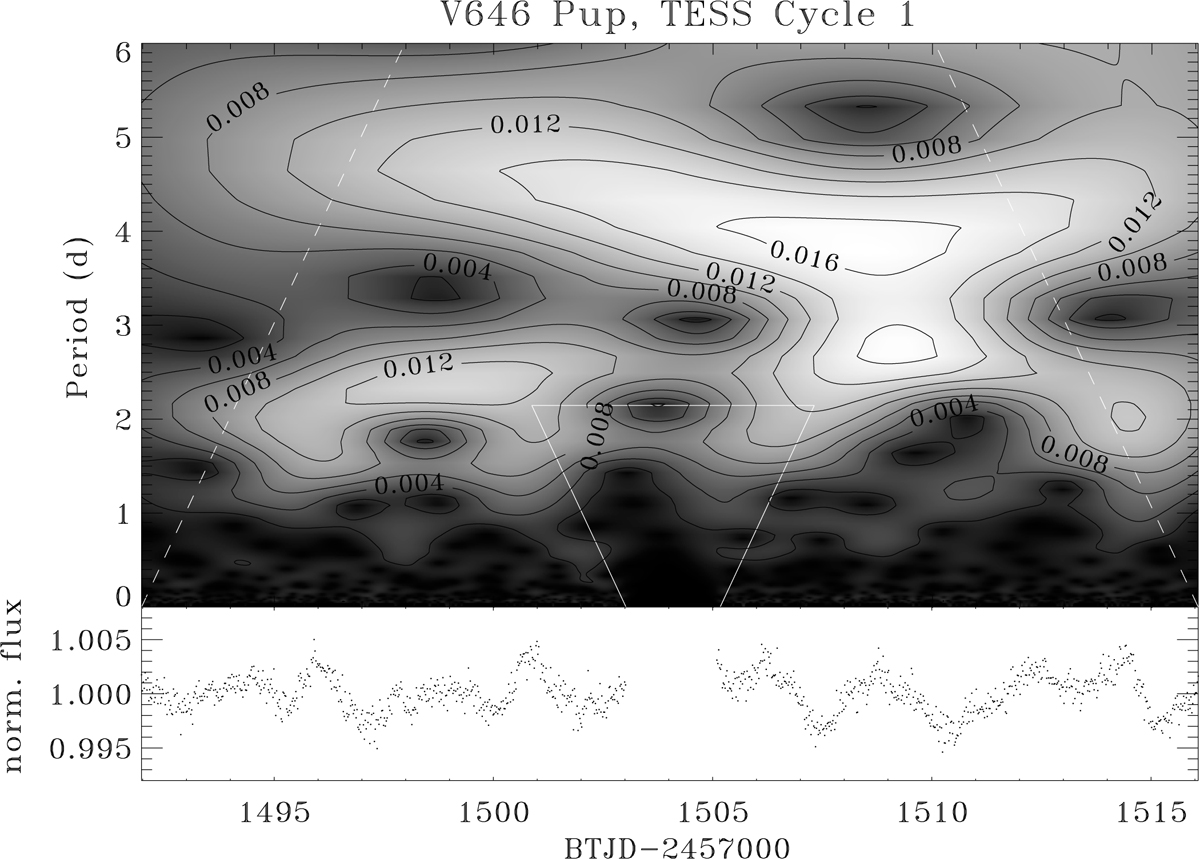
Wavelet spectrum of the detrended (Fig. 2c) light curve. The amplitude is expressed by the grey-scale and solid black lines with values. The white continuous trapezium lines indicate region completely distorted by the break in the data acquisition (although the affected area does likely propagate to longer periods, inside the cone defined by the virtual extension of the trapezium). Edge effects are contained outside the white dashed lines.
Current usage metrics show cumulative count of Article Views (full-text article views including HTML views, PDF and ePub downloads, according to the available data) and Abstracts Views on Vision4Press platform.
Data correspond to usage on the plateform after 2015. The current usage metrics is available 48-96 hours after online publication and is updated daily on week days.
Initial download of the metrics may take a while.