Fig. 5.
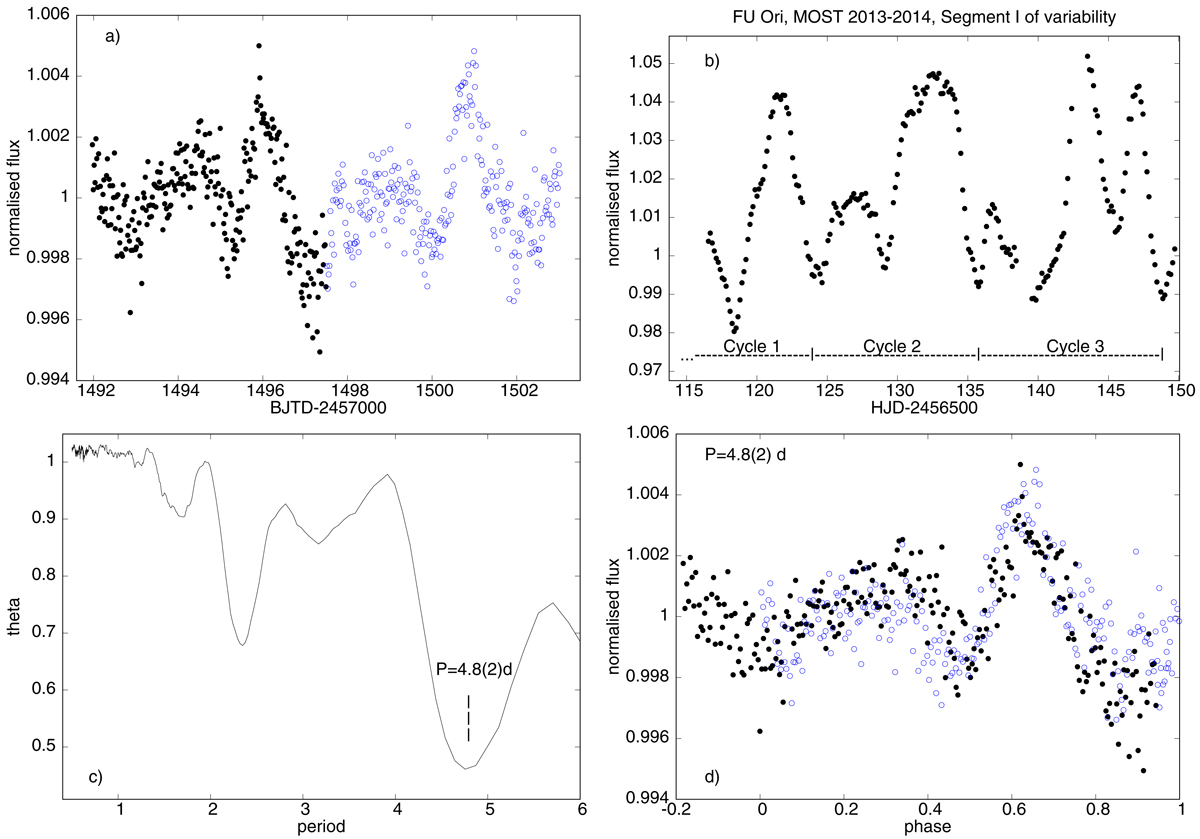
Light curve of V646 Pup gathered during the first TESS orbit, with consecutive variability patterns indicated by different symbols (panel a). It is similar to FU Ori observed by MOST in 2013–2014 (panel b). Phase dispersion minimanisation period search based on θ statistics indicates 4.8 ± 0.2 day period (panel c). Last panel d shows the same data as the first panel, phased with the above value.
Current usage metrics show cumulative count of Article Views (full-text article views including HTML views, PDF and ePub downloads, according to the available data) and Abstracts Views on Vision4Press platform.
Data correspond to usage on the plateform after 2015. The current usage metrics is available 48-96 hours after online publication and is updated daily on week days.
Initial download of the metrics may take a while.