Free Access
Fig. 8.
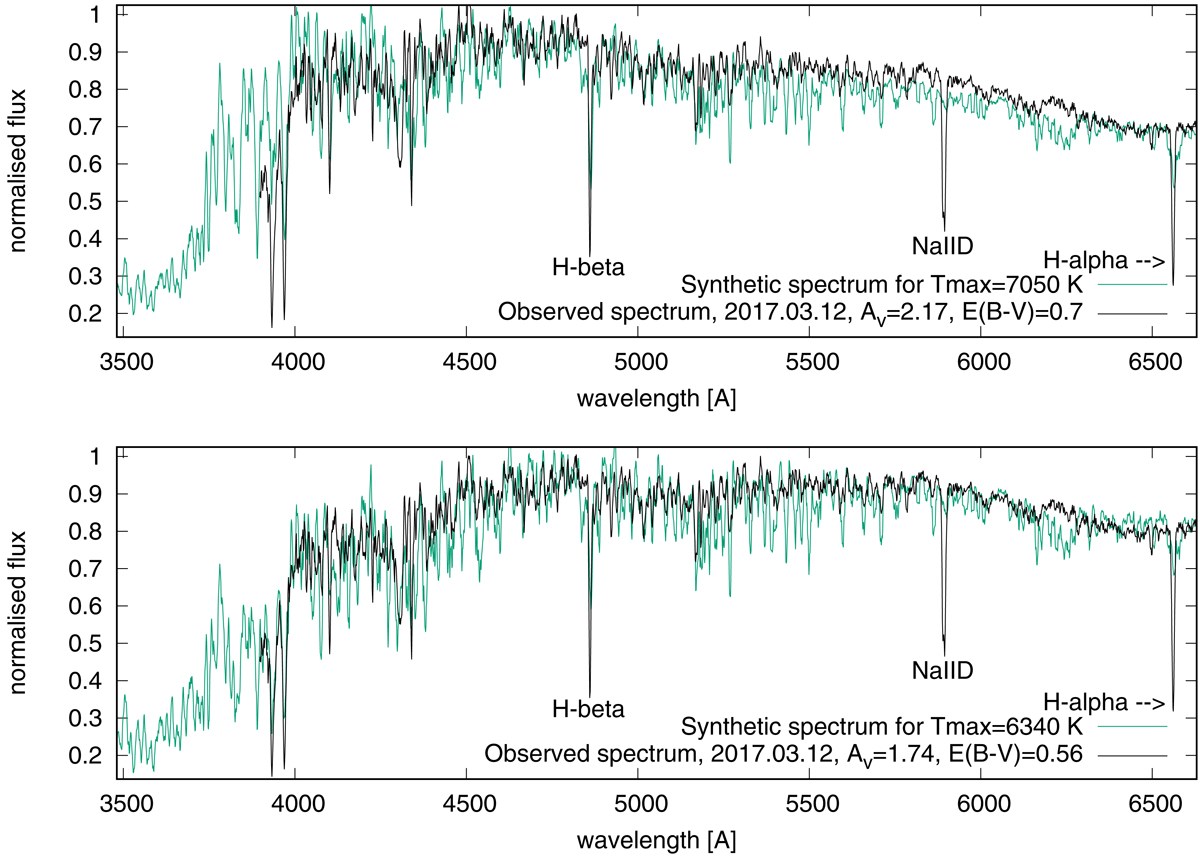
Comparison of spectrum observed on March 12, 2017, with two synthetic spectra. The observed spectrum was dereddened using an appropriate set of AV and E(B − V) values corresponding to the assumed maximum disc temperature Tmax.
Current usage metrics show cumulative count of Article Views (full-text article views including HTML views, PDF and ePub downloads, according to the available data) and Abstracts Views on Vision4Press platform.
Data correspond to usage on the plateform after 2015. The current usage metrics is available 48-96 hours after online publication and is updated daily on week days.
Initial download of the metrics may take a while.