| Issue |
A&A
Volume 643, November 2020
|
|
|---|---|---|
| Article Number | A74 | |
| Number of page(s) | 11 | |
| Section | Extragalactic astronomy | |
| DOI | https://doi.org/10.1051/0004-6361/202039114 | |
| Published online | 05 November 2020 | |
Disc galaxy resolved in H I absorption against the radio lobe of 3C 433: Case study for future surveys
1
Kapteyn Astronomical Institute, University of Groningen, Postbus 800, 9700 AV Groningen, The Netherlands
e-mail: This email address is being protected from spambots. You need JavaScript enabled to view it.
2
ASTRON, the Netherlands Institute for Radio Astronomy, Postbus 2, 7990 AA Dwingeloo, The Netherlands
3
National Radio Astronomy Observatory, 520 Edgemont Road, Charlottesville, VA 22903, USA
4
Centro de Astrobiología, (CAB, CSIC-INTA), Departamento de Astrofísica, Cra. de Ajalvir Km. 4, 28850 Torrejón de Ardoz, Madrid, Spain
Received:
5
August
2020
Accepted:
17
September
2020
Abstract
The neutral atomic gas content of galaxies is usually studied in the H I 21 cm emission line of hydrogen. However, as we go to higher redshifts, owing to the weak strength of the transition, we need very deep integrations to detect H I emission. The H I absorption does not suffer from this dependence on distance as long as there is a sufficiently bright radio source to provide the background continuum. However, resolved H I absorption studies of galaxies are rare. We report one such rare study of resolved H I absorption against the radio galaxy 3C 433 at z = 0.101, detected with the Very Large Array. The absorption was known from single-dish observations, but owing to the higher spatial resolution of our data, we find that the absorber is located against the southern lobe of the radio galaxy. The resolved kinematics shows that the absorber has regular kinematics with an H I mass ≲3.4 × 10⁸ M⊙ for Tspin = 100 K. We also present deep optical continuum observations and Hα observations from the Gran Telescopio CANARIAS (GTC), which reveal that the absorber is likely to be a faint disc galaxy in the same environment as 3C 433, with a stellar mass of ∼1010 M⊙ and a star-formation rate of 0.15 M⊙ yr−1 or less. Considering its H I mass, H I column density, stellar mass, and star-formation rate, this galaxy lies well below the main sequence of star forming galaxies. Its H I mass is lower than the galaxies studied in H I emission at z ∼ 0.1. Our GTC imaging has revealed, furthermore, interesting alignments between Hα and radio synchrotron emission in the H I companion and in the host galaxy of the active galactic nucleus as well as in the circumgalactic medium in between. This suggests that the shock ionization of gas by the propagating radio source may happen across a scale spanning many tens of kpc. Overall, our work supports the potential of studying the H I content in galaxies via absorption in the case of a fortuitous alignment with an extended radio continuum source. This approach may allow us to trace galaxies with low H I masses which would otherwise be missed by deep H I emission surveys. In conjunction with the deep all-sky optical surveys, the current and forthcoming blind H I surveys with the Square Kilometre Array (SKA) pathfinder facilities will be able to detect many such systems, though they may not be able to resolve the H I absorption spatially. Phase 1 of the SKA, with its sub-arcsecond resolution and high sensitivity, will be all the more able to resolve the absorption in such systems.
Key words: galaxies: active / radio lines: galaxies / galaxies: ISM / galaxies: individual: 3C 433
© ESO 2020
1. Introduction
Neutral atomic hydrogen (H I) plays an important role in the formation and evolution of galaxies. Hence, attaining a deeper understanding of this component of gas in galaxies (i.e. the content, distribution, kinematics, etc.) is of interest in the study of galaxy evolution. The H I content, traced by the 21cm line, in galaxies in the local Universe has been studied extensively in emission (e.g. Wright 1971; Rogstad et al. 1974; Sancisi 1976; van der Kruit & Allen 1978; van der Hulst 1979; van der Hulst et al. 1987; Oosterloo & Shostak 1993; Barnes et al. 2001; Koribalski et al. 2004; Giovanelli et al. 2005a,b; Catinella et al. 2010, 2012; Spekkens et al. 2014; Odekon et al. 2016; Jones et al. 2018). These studies have provided insights into the relation between H I content and stellar mass, galaxy structure, star-formation rate, etc. There have also been extensions of such studies beyond the local universe (e.g. Catinella et al. 2008; Catinella & Cortese 2015; Verheijen et al. 2007; Hess et al. 2019; Bera et al. 2019; Blue Bird et al. 2020; Gogate et al. 2020). However, even with very deep integrations, direct detections of H I in emission have so far been from gas-rich, star-forming galaxies (≥2 × 10⁹ M⊙; e.g. Zwaan et al. 2001; Catinella et al. 2012; Fernández et al. 2016; Hess et al. 2019) and mostly for redshifts below z ∼ 0.1.
H I absorption studies do not suffer from this limitation of redshift because the detection of H I in this case is possible within short integration times provided there is a strong radio continuum in the background. Hence, H I absorption studies have been employed extensively to study atomic gas in damped Lyman-α systems and MgII absorbers (e.g. Kanekar et al. 2009, 2014; Gupta et al. 2009) and the host galaxies of active galactic nuclei (AGN; e.g. Morganti et al. 2005, 2013; Allison et al. 2015; Aditya et al. 2016, 2017; Chowdhury et al. 2020; Morganti & Oosterloo 2018, and references therein) as well as in the study of the distribution of H I in the halo of galaxies (e.g. Gupta et al. 2010; Borthakur 2016; Dutta et al. 2017). However, by design, these studies have mostly focused on compact radio sources.
In cases where the absorption is detected against an extended radio continuum, it is possible to study the absorber in greater detail. The properties of H I at parsec scales have been probed against the extended radio continuum using very long baseline interferometry techniques (e.g. Borthakur et al. 2010; Srianand et al. 2013; Gupta et al. 2018; Schulz et al. 2018). When it is possible to resolve H I absorption at kpc scales, we can extract information that is similar to what we obtain from H I emission studies on the distribution and kinematics of cold gas at galactic scales. Yet, there have only been a few studies so far where a galaxy has been imaged in H I absorption at kpc scales; for example, the intervening spiral galaxies towards 3C 196 at z ∼ 0.4, PKS 1229−021 at z ∼ 0.395 (Kanekar & Briggs 2004) and the spiral galaxy UGC 00439 at z ∼ 0.02 of a quasar-galaxy pair (Dutta et al. 2016). A great deal can also be inferred even when the absorption itself is unresolved, but knowledge of the background radio structure at a higher spatial resolution is available, which can be used to constrain the nature of the absorbing gas via modelling (e.g. Briggs 1999; Briggs et al. 2001; Murthy et al. 2019).
With the commencement of large, deep, blind H I surveys planned with the Square Kilometre Array (SKA) and its pathfinder and precursor facilities, which are capable of simultaneously covering a large redshift range, there is the potential to expand such studies to large numbers and to gain particularly valuable insights at higher redshifts.
Here, we present an example of such a study of resolved H I absorption towards the radio galaxy 3C 433. As we detail below, 3C 433 has a highly asymmetric radio morphology with most of the flux density arising from the southern lobe. The H I absorption was detected towards 3C 433 by Mirabel (1989) using the Arecibo telescope. Due to the brightness asymmetry in the radio continuum, the authors proposed that the absorption is likely to arise against the southern lobe. Since the large size of the lobe could provide an extended background, this system is a good candidate for carrying out a resolved H I study in absorption.
The peculiar radio morphology of 3C 433, as seen in Fig. 1, has already been discussed in various studies (e.g. van Breugel et al. 1983; Parma et al. 1991; Black et al. 1992; Leahy et al. 1997). It has a projected angular size of 58″, corresponding to a linear size of 110 kpc. It has a weak radio core at the base of a highly collimated jet expanding to the north. The jet is initially slightly curved and has a gap in the middle. There is no similar jet-like feature to the south. Instead, the southern lobe has a large opening angle (80°) right at the beginning and contributes to ∼85% of the radio emission from this source at 1.4 GHz. The southern lobe does not exhibit a relaxed morphology but, instead, it protrudes at the end of the lobe as if it has been pinched. It also contains a hotspot and various complex and fine structures (see e.g. Fig. 19 in Leahy et al. 1997). Thus, in the Fanaroff & Riley (1974, FR) classification scheme, 3C 433 is a hybrid-morphology source exhibiting an FR I radio jet and an FR II radio lobe. In addition, the southern lobe has a faint wing on the western side, which appears to lie at the same angle from the core as the outer emission in the northern lobe. This emission gives 3C 433 an X-shaped appearance (e.g. Lal & Rao 2007; Gillone et al. 2016).
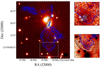 |
Fig. 1. Left panel: optical image of 3C 433 environment from GTC is shown in the background. Black contours show the radio continuum at 1.12 GHz as observed with the VLA. Contours start from 4σ (13 mJy beam−1) and increase by a factor of 2. Our VLA radio image has a beam of 5.39″ × 4.72″, shown in the bottom right corner. Blue contours show the 3.6 cm map by Black et al. (1992). Contour levels start from 30 μJy beam−1 (3σ) and increase by a factor of two. The region in the white box is blown up in the two images on the right panel. The radio core of 3C 433 as identified by van Breugel et al. (1983) is marked with a black cross. Right panel (bottom): blow-up of the image in the left panel with the H I column density (NHI) contours shown in white. The NHI contours start from 0.7 × 10¹⁸(Tspin/f) cm−2 and increase in steps of 0.3 × 10¹⁸(Tspin/f) cm−2. The image clearly shows that the H I absorber overlaps with an optical galaxy. Right panel (top): Hα contours (from GTC) overlaid on the optical image. The Hα contours levels are: (2.7, 3.2, 3.7, 4.3, 4.9, 5.4, 6 and 6.4) × 10−18 erg s−1 cm−2. The 3.6 cm radio contours (same as that in the left panel) are shown in blue. |
The host galaxy of the 3C 433 is a part of an interacting pair, enclosed in a common envelope (see Fig. 1; Matthews et al. 1964; van Breugel et al. 1983; Baum et al. 1988; Smith & Heckman 1989; Black et al. 1992). It has been found to have young stellar population with ages 0.03 < tYSP < 0.1 Gyr (Tadhunter et al. 2011), which is very likely formed due to the ongoing interaction. Miller & Brandt (2009) have carried out X-ray observations with Chandra and find diffuse X-ray emission in the soft-band, which curves along the east side of the southern lobe in the 0.5–2 keV smoothed image.
In order to localise and, if possible, resolve the H I absorber, we observed 3C 433 with NSF’s Karl G. Jansky Very Large Array (VLA) in the B configuration. Furthermore, to better characterise the absorber, we also obtained deep, narrow, and medium band optical continuum and Hα images of the field with the Gran Telescopio CANARIAS (GTC). Interestingly, we find that the absorption is due to an intervening disc galaxy with a redshift close to that of 3C 433. This allows us to study the properties of the galaxy in detail and explore the possibility of an interaction between the radio lobe of 3C 433 and the galaxy, as well as its effect on the observed morphology of the radio lobe.
We describe our radio and optical observations in Sect. 2, present our results in Sect. 3, and discuss the possible origin of the H I absorption and its implications in Sect. 4. Finally, we summarise our findings in Sect. 5. We have assumed a flat universe with H0 = 67.3 km s−1 Mpc−1, ΩΛ = 0.685, and ΩM = 0.315 (Planck Collaboration XVI 2014) for all our calculations. 3C 433 is at z = 0.1016 ± 0.0001 (an optical systemic velocity of 30458.9 km s−1; Schmidt 1965; Hewitt & Burbidge 1991) where 1″ corresponds to 1.943 kpc.
2. Observations and data reduction
2.1. VLA observations
Our VLA observations were carried out in July 2002 with antennas in B configuration (project id: AM0730). We observed 3C 433 for 4.5 h in total. Because the observations were performed before the upgrade to the VLA wideband WIDAR correlator, only a single Stokes parameter (RR) was used in order to cover a sufficiently wide bandwidth of 6.2 MHz subdivided into 127 channels. The observations consisted of interleaved scans on the flux and bandpass calibrator (3C 48), the phase calibrator (B2 2113+29), and the target.
The data reduction was done in “classic” AIPS (Astronomical Image Processing Software). We first flagged the bad baselines and bad data. Then determined the antenna-dependent gain and bandpass solutions using the data on calibrators. We then iteratively improved the gain solutions via self-calibration. Initially, we carried out a few cycles of imaging and phase-only self-calibration. Then carried out a round of amplitude and phase self-calibration and imaging. We then subtracted the continuum model from the calibrated visibilities and flagged the residual UV data affected by radio frequency interference. We fit a second-order polynomial to the line-free channels of each visibility spectrum. Finally, we imaged this UV data to get the spectral cube.
We made the continuum map using robust weighting of −1, averaging all the line-free channels together. It has a restoring beam of 5.39″ × 4.72″ with a position angle of −89.27° and has an RMS noise of ∼2.6 mJy beam−1. We made the spectral cube with the same weighting and the same restoring beam as the continuum map. It has an RMS noise of ∼1.2 mJy beam−1 channel−1 for a channel width of 12.5 km s−1, without any spectral smoothing. The H I moment maps (shown in Figs. 1 and 4) were produced from this spectral cube by adding the channels across which the absorption was found.
The peak flux density of the target is 1.3 ± 0.1 Jy beam−1. The integrated flux density is 14.2 ± 0.7 Jy. The southern lobe contains ∼85% of the total flux density (∼13 Jy). The uncertainty on the flux density scale at the observed frequency is assumed to be 5% (Perley & Butler 2017).
More recent VLA observations of 3C 433 from 2017 (project id: 17B-016) are available in the archive. A part of these observations was carried out in spectral line mode with a 16 MHz band, centred at the redshifted HI 21 cm frequency, subdivided into 1024 channels. Thus, these data have a significantly better spectral resolution that would enable us to study the absorption profile in greater detail. Unfortunately, these observations are severely affected by RFI and the data are unusable.
2.2. Optical and Hα data
Optical narrow and medium band images of 3C 433 were taken with the GTC on 11 Sept 2017 (project GTC48-17B), using the Optical System for Imaging and low-Intermediate-Resolution Integrated Spectroscopy (OSIRIS). The Hα emission line was captured using the tunable narrow-band filter f723/45, centred at a wavelength of 7234 Å with a full width at half the maximum intensity (FWHM) of 20 Å. The continuum emission was observed with the medium-band order sorter filter f666/36, which has a central wavelength of 6668 Å and an FWHM of 355 Å. This corresponds to r-band wavelengths and is free of emission lines. The total on-source exposure time was 1 h in the narrow-band filter, divided into 15 dithered exposures of 250 s. For the medium-band filter, this was 25 min, with 15 dithered exposures of 100 s. The observations were performed in queue mode under seeing conditions of roughly 1″.
We reduced the data using the Image Reduction and Analysis Facility (IRAF; Tody 1986). After a standard bias subtraction and flat-fielding, we co-added the images in each filter while removing cosmic ray. Because the wavelength tuning is not uniform for the OSIRIS narrow-band filters, the effective field of view is significantly smaller than the unvignetted 7.8′ coverage of the CCD, and background gradients are introduced in the narrow-band imaging. We removed these background gradients as best as possible by fitting a 2-D polynomial to the background emission and subtracting this from the narrow-band image. We used the same technique to produce the medium-band image of the continuum. We then subtracted the medium-band continuum image from the narrow-band image to obtain an image with only Hα emission. We did this by scaling down the raw counts of the continuum image by a factor 5.75 (derived empirically) and then subtracted that from the narrow-band image. In the resulting Hα image, any remaining background gradient was removed by fitting the background separately across RA and Dec while manually excluding emission from galaxies, stars and artefacts, and then subtracting a 2D average of these RA and Dec fits from the Hα image. Due to the large uncertainty in absolute astrometry of the GTC data, we shifted the final GTC images by 2″ to align with the existing Hubble Space Telescope (HST) imaging. We would like to note here that the artefacts associated with the point or highly nucleated sources seen in the Hα images are unavoidable. Spatial shifts of a small fraction of a pixel or small differences in seeing size between the continuum and narrowband images (or both) will always produce such artefacts.
We do not have an absolute calibration for our GTC images since we did not observe a standard star, as that would have resulted in a large increase in the overhead time for these queue-mode observations. Fortunately, a part of the field covered by our observation has been observed by the Sloan Digital Sky Survey (SDSS) and, hence, the SDSS stars could be used for calibration. To this end, we first extracted the point sources in our image using SEXTRACTOR (Bertin & Arnouts 1996). The software generated a catalogue of sources from which we selected those sources with CLASS_STAR > 0.85 and FLAG < 4. This was done to ensure that we selected only the point sources which are not saturated. We extracted the instrumental magnitudes for these stars from SEXTRACTOR via the MAG_AUTO parameter. We cross-matched the stars thus obtained with the stars in the SDSS Data Release 12 r-band catalogue (Alam et al. 2015). Thence, we obtained the zero-point magnitude by taking the difference between the SDSS magnitude and the magnitude obtained from SEXTRACTOR. The final zero-point magnitude is the mean of the zero-point magnitudes thus obtained. We obtained a final zero-point magnitude of 26.71 ± 0.49 for our continuum image. The GTC images, corrected for the astrometric offset using the HST imaging as mentioned above, align with the SDSS stars.
As we go on to explain in the sections to follow, a faint galaxy located close to the edge of the southern radio lobe of 3C 433 is of particular interest for this work. Figure 2 shows the medium-band, narrow-band, and Hα GTC images of this galaxy. We used GALFIT (Peng et al. 2002, 2010) to characterise this galaxy. We used a cutout of the field (123 × 134 pixels), including the galaxy, as the input to GALFIT. We fit for the centre of the galaxy, integrated r-band magnitude, effective radius (re), axial ratio, and the sky background. The initial guess for the centre of the galaxy, effective radius, and the axial ratio were determined visually. The initial guess for the integrated r-band magnitude was input from the Panoramic Survey Telescope and Rapid Response System (Pan-STARRS) r-band catalogue (Chambers et al. 2016; Flewelling et al. 2016) in which the galaxy is detected. We fine-tuned the initial parameters over a few iterations and found that the final fit values agreed within the error bars. This galaxy has also been detected in the Pan-STARRS g-band image. We extracted the g-band integrated magnitude of the galaxy following the same procedure as mentioned for our continuum image using SEXTRACTOR and GALFIT on the Pan-STARRS image. We have summarised the fit parameters in Table 1.
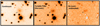 |
Fig. 2. GTC imaging of the galaxy at the location of the H I absorption. Shown: the r-band continuum image (left), the narrow-band image with both Hα and continuum included (middle), and the continuum-subtracted Hα image (right). The galaxy is indicated by the black arrow in each panel. The details on these images are given in Sect. 3. |
Summary of the GALFIT parameters.
Then we performed aperture photometry in continuum using Photoutils of Astropy package under Python software (Bradley et al. 2019). We used circular apertures of radii varying from 0.1re to re. We did not extend beyond the unit effective radius for the presentation of the surface brightness profile due to the presence of a bright source to the south of the galaxy whose contribution would become significant beyond that distance. The choice of circular aperture was motivated by the high axial ratio of the galaxy (see Sect. 3) as obtained from GALFIT. We discuss the parameters obtained in Sect. 3.2.
3. Results
The radio and the optical data both show interesting and new features. We describe them below, including the optical properties of both the host galaxy of 3C 433 and its environment. We then focus only on the H I absorber in the discussion in Sect. 4.
3.1. Radio continuum and the HI absorption
Our VLA continuum map of 3C 433 is shown in Fig. 1, left panel in black contours. Due to low spatial resolution, the fine structures and the hot-spot in the southern lobe mentioned in Sect. 1 are smoothed out in our continuum map. However, the X-shaped morphology and the brightness difference between the northern and southern lobes are evident.
As expected, we detected the H I absorption and, interestingly, we find that the absorption is confined to the southern part of the southern lobe. The location of the H I absorption is indicated by the white contours in Fig. 1 (bottom-right panel). As mentioned in Sect. 1, Mirabel (1989) had suggested that the H I absorption may arise towards the southern radio lobe since it contains most of the flux. Our observations clearly show that the H I is confined (in projection) to a small part of the lobe. This is essential for the interpretation of the origin of the absorption, as we discuss in Sect. 4. The integrated H I absorption profile extracted from the region detected in H I absorption is shown in Fig. 3. The absorption is ∼50 km s−1 blue-shifted from the systemic velocity of 3C 433, which is in agreement with that reported by Mirabel (1989). The integrated absorption line is ∼40 mJy deep and has a full width at zero intensity (FWZI) of ∼80 km s−1.
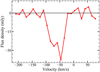 |
Fig. 3. Integrated H I absorption spectrum from the VLA. The spectrum has been shifted to the restframe of 3C 433 i.e. z = 0.1016 ± 0.0001. We see that the peak absorption is only ∼50 km s−1 blueshifted with respect to the systemic velocity of 3C 433. The VLA spectral cube has an RMS noise of 1.2 mJy beam−1 and a velocity resolution of 12.5 km s−1. |
The H I column density distribution is shown in Fig. 1, bottom-right panel. The average H I column density is (1.0 ± 0.2)×1018(Tspin/f) cm−2 where Tspin is the gas spin temperature and f is the covering factor which, in this case, is unity on the account of the absorber being resolved. The absorber is ∼60 kpc, in projection, from the radio core of 3C 433 identified by van Breugel et al. (1983). The velocity field is shown in Fig. 4 and Fig. 5 shows the position-velocity (PV) diagram along the major axis of the absorber. We find that the velocity gradient is smooth throughout the structure, and is probably related to rotation.
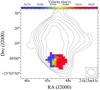 |
Fig. 4. H I absorption velocity field with the contours of the radio continuum of 3C 433 (from the VLA observations) overlaid. Contour levels and the beam (shown in the bottom right corner) are as in Fig. 1. |
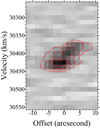 |
Fig. 5. H I position-velocity diagram of the absorber galaxy extracted along the major axis of the H I absorption (i.e. ∼63°, visually determined). Contour levels are: 3.5, 7.3, 11.7, 16.0, and 20.4 mJy beam−1. The systemic velocity of 3C 433 is 30458.9 km s−1. |
There is a steep gradient in the brightness of the southern lobe and the flux density decreases away from the region overlapping with the detected H I. The average flux density in the region immediately northwards of the absorber is ∼700 mJy beam−1. Using this and assuming an absorption profile of the same FWHM as the detected integrated absorption (60 km s−1), we derive a 3σ H I column density sensitivity of 7.5 × 10¹⁷(Tspin/f) cm−2 towards regions northwards of the absorber. Similarly, the average flux density to the south of the absorber is ∼50 mJy beam−1. That gives us a 3σ sensitivity of 9 × 10¹⁸(Tspin/f) cm−2 in the regions south to the absorber. Thus, if there is more of H I in the region northwards that is covered by the radio continuum, we would have been able to detect it but not towards the southern regions, where the continuum emission drops rapidly.
3.2. Optical and Hα counterparts of the H I absorber
As can be seen from Fig. 1, a faint galaxy is present, in projection, at the location of the H I absorption and, hence, it is of interest as a possible candidate giving rise to the absorption. Because of this, we characterised this galaxy further using the methods described in Sect. 2. The galaxy is shown clearly in Fig. 2 and has an effective radius, re = 3.3″, that is, 6.3 kpc and an axial ratio of 0.88. Figure 8 shows the surface brightness profile of this galaxy up to one effective radius. We find that an exponential disc fits the surface brightness profile very well.
We measured an r-band integrated apparent magnitude of mr = 16.61. As mentioned in Sect. 2, this galaxy has also been detected by Pan-STARRS in g-band with an integrated apparent magnitude, mg = 17.22. Thus, the K-corrected (Chilingarian et al. 2010; Chilingarian & Zolotukhin 2012) g − r colour of the galaxy is 0.46. Using the correlation between the mass-to-light ratio and the K-corrected g − r colour given by Bell et al. (2003), we obtain a stellar mass M* ∼ 6.7 × 10¹⁰ M⊙ for the galaxy.
Our GTC observations reveal an interesting morphology for the Hα emitting gas in this galaxy as shown in Fig. 1 top-right panel. We detected Hα emission from the central stellar region of the galaxy and also along the eastern edge. It is worth noting that this outer Hα blob coincides with the outer boundary of the radio lobe (see Fig. 1). We come back to this aspect in Sect. 4. One possibility is the presence of an interaction between the radio lobe and the galaxy, and that this component of Hα emission is due to shock excitation of the gas resulting from this.
The total Hα flux from the galaxy is 5 × 10⁻¹⁶ erg cm−2 s−1 while the emission from only the central region is ∼2 × 10⁻¹⁶ erg cm−2 s−1. With these Hα fluxes, we can estimate the star-formation rate (SFR) using the Kennicutt-Schmidt law (Kennicutt 1998). Assuming that all the Hα emission detected from the galaxy arises from star formation activity, we obtain a star-formation rate (SFR) of 0.11 M⊙ yr−1. If only the Hα emission arising from the centre of the galaxy is due to star formation (while the eastern Hα component is due to shock excitation), we obtain a lower limit to the SFR of 0.035 M⊙ yr−1. The SFR is lower even if we are to infer it from other tracers such as the infrared (IR) luminosity: following Kewley et al. (2002), we use the relation SFR (IR) ∼2.7 × SFR (Hα)1.3 and find that SFR(IR) ranges from 0.15 M⊙ yr−1 to 0.034 M⊙ yr−1 for the two cases mentioned above.
We note here that the H I centre of the galaxy is offset from the optical centre (Fig. 1, bottom-right panel). The left panel of the same figure shows the location of the optical galaxy with respect to the radio lobe (at higher spatial resolution than our VLA map; blue contours). We find that the radio continuum does not intercept the galaxy in its entirety since the latter is located at the boundary of the former. Therefore, it is likely that a part of the H I disc could be missing due to the absence of background radio continuum in that region. Thus, the mismatch between the H I and optical centres could be due to the non-detection of a part of the H I disc.
3.3. Hα in the host galaxy of 3C 433
3C 433 is associated with one of the galaxies in an interacting pair surrounded by a common envelope (Matthews et al. 1964). Earlier optical broad-band, narrow-band Hα and spectroscopic studies of the system have shown clear Hα filaments, a young stellar population, and signs of recent disturbance in the form of distorted dust lanes (e.g. Baum et al. 1988; de Koff et al. 1996, 2000; Holt et al. 2007; Tadhunter et al. 2011).
Our optical image of 3C 433 and its environment is shown in Fig. 1. It is of much better sensitivity and has a superior angular resolution compared to the Pan-STARRS r-band image. We clearly see the optical counterpart of 3C 433 along with its companion galaxy. Additionally, we also clearly detect shells around this interacting pair, very likely caused due to their interaction.
Figure 6 shows the Hα emission-line image of radio galaxy 3C 433 and its circumgalactic environment. The Hα emission at the location of the host galaxy of 3C 433 shows an elongated structure, previously seen by Baum et al. (1988). The total extent of the Hα structure is ∼10″ (∼19 kpc). The brightest patch of Hα emission corresponds to the peak in the continuum image, hence we argue that this is most likely the core of 3C 433.
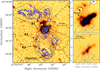 |
Fig. 6. Hα image of 3C433 and its environment. Left: low surface-brightness emission in the circum-galactic environment of 3C 433, showing the companion galaxy to the south and several Hα emitting regions. The white dots are mostly the residuals of saturated foreground stars that could not be accurately subtracted. The black and dark blue contours show the low- and high-resolution VLA radio continuum images previously shown in Fig. 1. The contour levels are at 0.2, 0.5, 1.0, 1.5, 2.0 mJy beam−1 for the high-resolution data (blue) and 15, 60, 700 mJy beam−1 for the low-resolution data (black). Light blue contours highlight the Hα emission shown in more detail on the right-hand side. The contour levels are at 4.3, 6.4, 12.8, 25.7, 47 percent of the peak intensity. Light-blue dashed line visualizes the direction perpendicular to the Hα structure in the center. Right: Hα emission in the central radio galaxy, shown at two different contrasts. |
A plume of Hα emission is seen to stretch roughly 4″ (∼8 kpc) north-east of the centre of the radio galaxy (see image in Fig. 6, top-right panel). This plume extends almost perpendicular to the radio axis. It could represent gas that is either being driven out of or being accreted onto the centre of the galaxy. Further to the north, at 9″ (∼17 kpc) distance from the radio galaxy, another region of enhanced emission appears in the Hα image. This region aligns with what appears to be a companion galaxy in the continuum image. It is not clear whether this emission is from the Hα-emitting gas in this companion galaxy, or residual emission left over from the continuum subtraction.
Figure 7 shows the Hα emission in the centre of 3C 433 overlaid onto a Hubble Space Telescope narrow-band image of [OIII] emission. The Hα emission shows a distribution that is very similar to the [OIII]-emitting gas in the inner 12 kpc. In turn, the [OIII] emission traces the inner radio jet. It is therefore likely that both the [OIII] and a large fraction of the Hα emission in the inner 12 kpc trace gas that is under the influence of the propagating radio jets. It is plausible that the radio jets have shock-ionized the gas, or even triggered star formation.
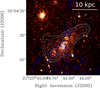 |
Fig. 7. HST image of [OIII] detected with filter FR533N18 centered at 5515.7 Å (νrest = 5007 Å). Overlaid are the contours of our Hα image (light blue) and VLA radio continuum (dark blue) from Fig. 6. The Hα emission follows the [OIII] emission, which, in turn, traces the outline of the inner radio jet. |
In addition to the co-alignment of Hα and [OIII] in the inner 12 pc, the Hα stretches further out to the north-west than the [OIII], in what was classified as a curving filament by Baum et al. (1988). The overall distribution of the Hα emission resembles a gaseous disc with an extent of ∼19 kpc, but this would have to be verified by observing the kinematics. If confirmed, this structure would be misaligned with the main radio axis by ∼40°. However, it is interesting to note that the outer faint wings of radio emission that give the 3C 433 its X-shape, lie at an angle of ∼90° with the optical structure and, thus, parallel to its minor axis, possibly corresponding to the rotation axis (see light-blue dashed line in Fig. 6). This would suggest that the central black hole and its accretion disk underwent a significant precession recently, possibly during the current episode of radio-AGN activity, whereby the jet direction changed by ∼50° in the plane of the sky. It is quite possible that such a precession may have been triggered by the ongoing galaxy interactions, and is the mechanism (of the many mechanisms proposed to explain the X-shape in radio galaxies; Cotton et al. 2020; Hardcastle et al. 2019) responsible for the observed X-shape of 3C 433.
3.4. The circumgalactic environment of 3C 433
The Hα image of Fig. 6 shows several other interesting features. At least three blobs of Hα emission are seen at distances of roughly 8, 23, 15, and 23 arcsec (16, 29, 45 kpc) from the centre of the radio galaxy. These blobs are marked with a black arrow in Fig. 6. Regions R1 and R2 only appear in the tunable filter image (Hα+continuum) and not in the continuum image, while the southernmost region (R3) has a higher contrast in the tunable filter compared to the continuum image. These three regions of enhanced Hα, therefore, most likely represent real emission-line regions. There may be other regions of Hα emission, for example, ∼7″ south-west of R3, but due to stronger underlying continuum at those locations, we cannot confirm this.
The northernmost region (R1) appears to be a weak emission-line feature stretching from the radio host galaxy. Interestingly, the three emission-line regions lie along an arc that follows the outer edge of the southern radio lobe. This could be tidal debris from material that is being redistributed across the circum-galactic environment of 3C 433. We hypothesise that the alignment with the outer edge of the radio source may occur because this circum-galactic material is being shocked and ionized by the propagating radio source, similar to what has been seen in Coma A (Morganti et al. 2002) and the Beetle Galaxy (Villar-Martín et al. 2017). The Hα regions are also aligned in the direction of the H I companion, although a direct connection between this circumgalactic gas and the H I companion is not apparent from our data.
4. Discussion
Our spatially resolved H I absorption observations of 3C 433 have shown that the absorption arises against the southern radio lobe, about 60 kpc away from the radio core. We find that the central velocity of the H I absorption is only ∼50 km s−1 blueshifted from the systemic velocity of 3C 433 (see Fig. 3), confirming that it belongs to the same environment. This combination of having the absorption spatially resolved and the absorber belonging to the same environment, and yet being located so far away from the central region of the background AGN, makes this system a rarity.
4.1. The H I absorber: a disc galaxy
What we observe in 3C 433 is different from the results commonly obtained from H I absorption studies of the gas associated with the radio AGN host galaxies. Those studies have mostly found that the H I absorption arises from the central (kpc) regions close to the core of the radio AGN (see Morganti & Oosterloo 2018, for an overview).
Instead, in this case, our optical image shows the presence of a galaxy coincident with the location of H I absorption. We propose that the H I detected in absorption belongs to this galaxy located in front of the southern radio lobe. The peak of the H I absorption is only ∼50 km s−1 bluewards of the systemic velocity of 3C 433 and, hence, very likely also belongs to the same environment. The galaxy has a stellar mass of ∼6.7 × 10¹⁰ M⊙. It has a surface brightness profile (see Fig. 8) characteristic of a disc galaxy.
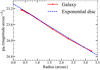 |
Fig. 8. Surface brightness profile of the absorber galaxy. For representation, we limit this to one effective radius. See Sect. 3 for details. |
Assuming a spin temperature of ∼100 K, a value typical of H I on galactic scales (e.g. Borthakur et al. 2010, 2014; Srianand et al. 2013; Reeves et al. 2015, 2016; Dutta et al. 2016, and references therein), we obtain an average H I column density of ∼1.0 × 1020 cm−2. For spiral galaxies, the average column density of the H I disc is about 6 × 1020 cm−2 (Wang et al. 2016), quite higher than our absorber galaxy. Instead, Serra et al. (2012) found that in gas-rich early-type galaxies, the typical column densities are around 1020 cm−2, which is very similar to what we observe. This suggests that our galaxy is a gas-rich early-type galaxy, which is also consistent with the fact that it lies off the star-forming main sequence (see Sect. 4.2).
Using this H I column density of the gas, we obtain the mass of the detected H I as ∼3.4 × 10⁸ M⊙. As mentioned in Sect. 3.1, it is likely that a portion of the galaxy has not been intercepted by the radio continuum. Since it is only a small part of the galaxy, we argue that the actual H I mass could at most be ∼7 × 10⁸ M⊙ (i.e. twice the estimated mass, assuming that half the disc has not been detected). This gives us an atomic gas fraction (fHI) of 0.008 for the galaxy.
As discussed in Sect. 4.3, there is a possibility of an interaction between the galaxy and the radio lobe. If this is the case, the spin temperature of H I could be higher. Assuming a Tspin of 1000 K for H I, gives an H I mass of ∼3.4 ×10⁹ M⊙ and an fHI of 0.08. There is a possibility that the observed absorption could also arise from a tail of tidal debris formed, for example, due to the ongoing merger event. We exclude this scenario since we do not see the presence of such prominent and large-scale structures in our optical image.
4.2. Comparison with galaxies observed in H I emission in the local Universe and beyond
As mentioned earlier, studies of spatially resolved H I absorption have been carried out, beyond the local universe, for only two intervening absorbers where the absorber galaxy and background radio source are of entirely different redshifts. A few cases have been presented in the literature of H I absorption due to intervening galaxies that belong to the same environment, (for example, B2 1321+31, J1337+3152, 3C 234, PKS 1649-062; Emonts 2006; Srianand et al. 2010; Pihlstrom 2001, Mahony priv. comm., respectively). However, the H I absorption in all these cases is unresolved due to which a detailed study of the absorber has not been possible. Unlike these systems, for 3C 433, it has been possible to characterise the absorber and, hence, to carry out a comparison with the samples of galaxies studied in H I emission – in the local universe and beyond.
At redshifts comparable to, or higher than that of, 3C 433 (i.e. z ≥ 0.1), there are not many studies of H I emission in galaxies (e.g. Catinella & Cortese 2015; Hess et al. 2019; Verheijen et al. 2007; Gogate et al. 2020). The stellar masses of the galaxies included in such studies are comparable to that of our galaxy, while their H I masses range from 2 × 10⁹ M⊙ to a few times 1010 M⊙, considerably greater than the H I mass of our galaxy. Similarly, their SFRs are between 0.3 M⊙ yr−1 and 35 M⊙ yr−1, much higher than that in our case.
Thus, this galaxy, detected via H I absorption, belongs to a population of galaxies which would be missed by the deep H I emission surveys. We note that this is likely to be a Malmquist bias since the emission studies are biased towards detecting the most HI-rich galaxies which is not the case with absorption studies.
Furthermore, we compare this galaxy with those studied in the local universe (e.g. the xCOLD GASS sample by Saintonge et al. 2017). Figure 9 shows the properties of the H I absorber compared to galaxies of this sample. The rectangle indicates the range of SFR of the galaxy depending on whether the detected Hα emission arises entirely from the SFR activity or not (see Sect. 3.2). We find that the galaxy lies well below the star-forming main sequence. The upper limit to the atomic gas fraction obtained by considering a Tspin of 1000 K is comparable to the galaxies lying below the main sequence. However, a more reasonable estimate of fHI obtained by assuming a Tspin of 100 K is lower even compared to the galaxies lying below the main sequence.
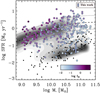 |
Fig. 9. SFR−M* plane for xCOLD GASS sample from Saintonge et al. (2017) with our H I absorbing galaxy marked in blue rectangle (colour-coded on the atomic gas fraction). The black dots represent H I non-detections in their sample while the grey contours represents the distribution of the SDSS galaxy population. The absorber galaxy is marked in a rectangle to represent the range of SFR derived; see Sect. 3.2 for details. The fH I, which corresponds to the ratio between MHI and (M* + MHI), for our H I absorber galaxy ranges between –1.1 and –2.1 (in logscale) for a Tspin of 1000 K and 100 K respectively. For plotting, we consider a Tspin of 1000 K. ©AAS. Reproduced with permission. |
Finally, given that the absorber galaxy belongs to a different population compared to those studied at similar redshifts, it is also interesting to test whether this galaxy conforms with the baryonic Tully-Fisher relation (bTFR) (McGaugh et al. 2000). To check the consistency with the baryonic Tully-Fisher relation, we need to determine the rotational velocity of the galaxy. We used 3D Barolo (Di Teodoro & Fraternali 2015) to this end and found that the inclination of the galaxy is low (≤20°) and, hence, it is not quite possible to constrain the rotational velocity. However, assuming an inclination angle of 20° results in a rotational velocity of ∼120 km s−1, for which the galaxy is consistent with the bTFR (McGaugh et al. 2000). For lower inclination angles, however, the galaxy is off the relation.
4.3. Is the radio lobe interacting with the galaxy?
The detected H I absorption is only ∼50 km s−1 blueshifted with respect to the systemic velocity of 3C 433 and, hence, the absorbing galaxy belongs to the same group of galaxies as 3C 433. Because of this, it is of interest to investigate the possibility of an interaction between the galaxy and the radio AGN. Figure 1 shows the location of the galaxy with respect to the radio lobe. We find that the end of the radio lobe is not relaxed but, instead, protruded as if pinched at the corners. Intriguingly, the location of the galaxy and especially the majority of the Hα emission arises, in projection, from the same region where the lobe appears pinched. It is quite possible that the radio lobe is interacting with the galaxy at this point and has acquired the observed morphology as a result.
Hα emission lends support to this possibility. Figure 1 shows in detail the location of Hα emission with respect to the radio lobe. We find that the emission has two components one arising from the central part of the galaxy and another located along the eastern boundary of the galaxy. It is very likely that these two components arise from two HII regions belonging to a spiral arm of the galaxy (see Fig. 2). Interestingly, the Hα blob along the eastern boundary of the galaxy also coincides with the boundary of the radio lobe in projection. Hence, we cannot rule out that an interaction with the radio lobe may be the cause of this blob. The radio lobe may have shock-ionised the gas in the galaxy, giving rise to the observed Hα morphology. As has been seen in other cases, for example in Coma A (Tadhunter et al. 2000; Morganti et al. 2002) and the Beetle galaxy (Villar-Martín et al. 2017), interactions between radio plasma and gas are very much capable of producing such structures. In fact, in 3C 433 we observe such an effect within the AGN host galaxy as well as on the circumgalactic scales: in the radio host galaxy 3C 433, the Hα follows [OIII] emission that aligns with the inner radio jet (Fig. 7), while blobs of Hα emission are also found to align along the edge of the southern radio lobe in the circumgalactic environment between 3C 433 and the H I companion (Fig. 6).
However, we would like to note that the morphology of the galaxy does not seem disturbed and the H I kinematics of the galaxy appear regular. Hence, we suggest that if there is any interaction between the radio lobe and the galaxy, it is only present at a mild level. A further investigation of this scenario of interaction is possible by studying the spectral index of the southern radio lobe at the location of the galaxy. In the presence of an interaction of radio plasma with the interstellar medium of the galaxy, the electrons at those sites of interaction would be re-accelerated (e.g. Harwood et al. 2013). Hence, we would expect the spectral index in those regions to be flatter compared to other regions of the lobe. A spectral index study of 3C 433 has been carried out by Lal & Rao (2007), however, the spatial resolution of their study was not high enough to resolve the southern lobe sufficiently. Thus, a high-resolution spectral index study (that may be carried out with, for example, LOFAR Two Meter Sky Survey, Shimwell et al. 2017) would help confirm this scenario.
Although it is very unlikely, it might also be possible that the observed Hα features are produced by the interaction of the radio lobe with the gas in the circumgalactic environment, which does not belong to the galaxy but overlaps with it only in projection. However, we do not have enough evidence to conclude either way based solely on the available data.
4.4. Blind H I absorption surveys in the SKA era
As we see in the previous sections of this paper, resolved H I absorption against an extended, bright-enough radio continuum can trace neutral hydrogen gas in galaxy populations beyond the local universe which would otherwise be missed by the current deep H I emission surveys. With the SKA pathfinder facilities and the SKA itself, it may be possible to expand the number of such studies since they provide a large field of view and a simultaneous coverage of a large range of redshift, thus increasing the chance of detection of H I absorption from intervening galaxies along the line of sight of an extended radio source in a single pointing.
Deep optical images of a large part of the sky are already available (e.g. SDSS, Pan-STARRS) and so are deep images of the radio sky at relatively high spatial resolution (e.g. VLASS, FIRST, LOFAR). A cross-match between the two would provide candidate systems where the extended radio emission overlaps, in projection, with a galaxy. Since the blind H I absorption surveys presently planned with the SKA pathfinders do cover a large area of the sky, it is possible to conduct a similar study of all these systems in a quasi-blind manner, without a preceding optical spectroscopic survey to ensure that the galaxy is in the foreground.
Apart from the chance alignment of extended, bright radio AGN and galaxies, high spatial resolution is another crucial requirement for such studies. Even at relatively low redshifts, for example at z ∼ 0.2, to be able to barely resolve a 50 kpc radio galaxy (∼4 beam elements; typical size of a high-redshift radio galaxy, e.g. Kanekar & Briggs 2004), the angular resolution needed is ∼3″. The current and forthcoming blind H I absorption surveys planned with the SKA-pathfinder facilities, namely, APERTIF (Oosterloo et al. 2009), MeerKat (Booth & Jonas 2012) and ASKAP (Johnston et al. 2008), will at best achieve an angular resolution of 6″ (by MeerKAT). Thus, further resolving the absorber galaxy which would only overlap with a small portion of the radio continuum may not be possible. However, even if unresolved, such studies will still be able to provide a census of low H I mass galaxy population beyond the local universe, while the more detailed H I mapping of galaxies in absorption may have to wait until SKA phase 1, whose sub-arcsecond angular resolution even at low frequencies (up to z ∼ 0.85) and unprecedented sensitivity have the potential to expand the study of such systems to statistical samples.
5. Summary
In this paper, we present an H I, Hα, and optical continuum study of the H I absorber against the radio galaxy 3C 433. The peculiar radio morphology of 3C 433, namely, the bright southern lobe, provides a favourable extended background continuum to resolve the foreground absorber. The absorber is only ∼50 km s−1 blueshifted from 3C 433 and, hence, it belongs to the same environment.
Our resolved H I absorption data obtained with the VLA in B array show that the absorber does not exhibit any sign of disturbance and has regular kinematics. With the help of our continuum and Hα images from GTC, we find that the absorber is a disc galaxy located at the boundary of the southern radio lobe. This galaxy has a stellar mass of ∼1010 M⊙ and a maximum star-formation rate of ∼0.15 M⊙ yr−1. We estimate the H I mass of this galaxy to be ∼3 × 10⁸ M⊙ and, furthermore, we find that the H I column density of the gas and star formation properties are representative of a gas-rich early-type galaxy off the star-forming main sequence.
We compare this result with the properties of galaxies detected in H I in the local universe as well as at redshifts ∼0.1. We find that for the given H I and stellar mass, and the star-formation rate, it is consistent with the galaxies in the local universe. However, the deep H I emission surveys at similar redshifts as our galaxy still have not detected galaxies of H I masses as low as this.
Since the absorber galaxy belongs to the same environment as 3C 433, we also investigate the possibility of an interaction between the southern radio lobe and the galaxy. Interestingly, we find that in projection, the galaxy is located at the boundary where the radio lobe exhibits a protruded morphology. The Hα emission from the galaxy shows two H II regions, one of which coincides with the boundary of the radio lobe. Together with the fact that Hα emission is also aligned with the radio continuum in the host galaxy of 3C 433 and at a few other locations along the southern radio lobe, this points to an interesting scenario where the radio AGN is directly interacting with a neighbouring galaxy.
Our study shows that in the case of a favourable alignment of a galaxy in front of an extended, bright-enough radio source, we can trace galaxy population in H I that would otherwise be missed by deep H I emission surveys. The deep blind H I absorption surveys with the SKA-pathfinder facilities, in conjunction with the deep optical images available from the all-sky surveys, may be able to detect more systems of this kind, although they will fall short of the desired spatial resolution to resolve the absorption. The SKA phase 1 with sub-arcsecond resolution and high sensitivity out to high redshifts has the potential to extend the reach of such studies.
Acknowledgments
We thank the referee for useful comments. SM is grateful to Anqi Li and Thijs van der Hulst for valuable discussions. SM would also like to thank Scott Trager, Teymoor Saifollahi, and Pavel E Mancera Piña for advice on analysing optical data. BE thanks Antonio Cabrera Lavers for advice on the GTC imaging. Part of the research leading to these results has received funding from the European Research Council under the European Union’s Seventh Framework Programme (FP/2007-2013)/ERC Advanced Grant RADIOLIFE-320745. MVM acknowledges support from grant PGC2018-094671-BI00 (MCI/AEI/FEDER,UE). Her work was done under project No. MDM-2017-0737 Unidad de Excelencia “María de Maeztu” Centro de Astrobiología (CSIC-INTA). The National Radio Astronomy Observatory is a facility of the National Science Foundation operated under cooperative agreement by Associated Universities, Inc. This work is based on observations carried out at the Observatorio Roque de los Muchachos (La Palma, Spain) with GTC (programme GTC48-17B). This research has made use of “Aladin sky atlas” developed at CDS, Strasbourg Observatory, France. We have also made use of the “K-corrections calculator” service available at http://kcor.sai.msu.ru/. The Pan-STARRS1 Surveys (PS1) have been made possible through contributions of the Institute for Astronomy, the University of Hawaii, the Pan-STARRS Project Office, the Max-Planck Society and its participating institutes, the Max Planck Institute for Astronomy, Heidelberg and the Max Planck Institute for Extraterrestrial Physics, Garching, The Johns Hopkins University, Durham University, the University of Edinburgh, Queen’s University Belfast, the Harvard-Smithsonian Center for Astrophysics, the Las Cumbres Observatory Global Telescope Network Incorporated, the National Central University of Taiwan, the Space Telescope Science Institute, the National Aeronautics and Space Administration under Grant No. NNX08AR22G issued through the Planetary Science Division of the NASA Science Mission Directorate, the National Science Foundation under Grant No. AST-1238877, the University of Maryland, and Eotvos Lorand University (ELTE). IRAF is distributed by the National Optical Astronomy Observatories, which are operated by the Association of Universities for Research in Astronomy, Inc., under cooperative agreement with the National Science Foundation.
References
- Aditya, J. N. H. S., Kanekar, N., & Kurapati, S. 2016, MNRAS, 455, 4000 [NASA ADS] [CrossRef] [Google Scholar]
- Aditya, J. N. H. S., Kanekar, N., Prochaska, J. X., et al. 2017, MNRAS, 465, 5011 [NASA ADS] [CrossRef] [Google Scholar]
- Alam, S., Albareti, F. D., Allende Prieto, C., et al. 2015, ApJS, 219, 12 [NASA ADS] [CrossRef] [Google Scholar]
- Allison, J. R., Sadler, E. M., Moss, V. A., et al. 2015, MNRAS, 453, 1249 [NASA ADS] [CrossRef] [Google Scholar]
- Barnes, D. G., Staveley-Smith, L., de Blok, W. J. G., et al. 2001, MNRAS, 322, 486 [NASA ADS] [CrossRef] [Google Scholar]
- Baum, S. A., Heckman, T. M., Bridle, A., van Breugel, W. J. M., & Miley, G. K. 1988, ApJS, 68, 643 [NASA ADS] [CrossRef] [Google Scholar]
- Bell, E. F., McIntosh, D. H., Katz, N., & Weinberg, M. D. 2003, ApJS, 149, 289 [NASA ADS] [CrossRef] [Google Scholar]
- Bera, A., Kanekar, N., Chengalur, J. N., & Bagla, J. S. 2019, ApJ, 882, L7 [CrossRef] [Google Scholar]
- Bertin, E., & Arnouts, S. 1996, A&AS, 117, 393 [NASA ADS] [CrossRef] [EDP Sciences] [Google Scholar]
- Black, A. R. S., Baum, S. A., Leahy, J. P., et al. 1992, MNRAS, 256, 186 [NASA ADS] [Google Scholar]
- Blue Bird, J., Davis, J., Luber, N., et al. 2020, MNRAS, 492, 153 [CrossRef] [Google Scholar]
- Booth, R. S., & Jonas, J. L. 2012, African Skies, 16, 101 [NASA ADS] [Google Scholar]
- Borthakur, S. 2016, ApJ, 829, 128 [NASA ADS] [CrossRef] [Google Scholar]
- Borthakur, S., Tripp, T. M., Yun, M. S., et al. 2010, ApJ, 713, 131 [NASA ADS] [CrossRef] [Google Scholar]
- Borthakur, S., Momjian, E., Heckman, T. M., et al. 2014, ApJ, 795, 98 [NASA ADS] [CrossRef] [Google Scholar]
- Bradley, L., Sipőcz, B., Robitaille, T., et al. 2019, Astropy/photutils: v0.6 [Google Scholar]
- Briggs, F. H. 1999, in Highly Redshifted Radio Lines, eds. C. L. Carilli, S. J. E. Radford, K. M. Menten, & G. I. Langston, ASP Conf. Ser., 156, 16 [Google Scholar]
- Briggs, F. H., de Bruyn, A. G., & Vermeulen, R. C. 2001, A&A, 373, 113 [NASA ADS] [CrossRef] [EDP Sciences] [Google Scholar]
- Catinella, B., & Cortese, L. 2015, MNRAS, 446, 3526 [NASA ADS] [CrossRef] [Google Scholar]
- Catinella, B., Haynes, M. P., Giovanelli, R., Gardner, J. P., & Connolly, A. J. 2008, ApJ, 685, L13 [NASA ADS] [CrossRef] [Google Scholar]
- Catinella, B., Schiminovich, D., Kauffmann, G., et al. 2010, MNRAS, 403, 683 [NASA ADS] [CrossRef] [Google Scholar]
- Catinella, B., Schiminovich, D., Kauffmann, G., et al. 2012, A&A, 544, A65 [NASA ADS] [CrossRef] [EDP Sciences] [Google Scholar]
- Chambers, K. C., Magnier, E. A., Metcalfe, N., et al. 2016, ArXiv e-prints [arXiv:1612.05560] [Google Scholar]
- Chilingarian, I. V., & Zolotukhin, I. Y. 2012, MNRAS, 419, 1727 [NASA ADS] [CrossRef] [Google Scholar]
- Chilingarian, I. V., Melchior, A.-L., & Zolotukhin, I. Y. 2010, MNRAS, 405, 1409 [NASA ADS] [CrossRef] [Google Scholar]
- Chowdhury, A., Kanekar, N., & Chengalur, J. 2020, ApJ, 900, L30 [CrossRef] [Google Scholar]
- Cotton, W. D., Thorat, K., Condon, J. J., et al. 2020, MNRAS, 495, 1271 [CrossRef] [Google Scholar]
- de Koff, S., Baum, S. A., Sparks, W. B., et al. 1996, ApJS, 107, 621 [NASA ADS] [CrossRef] [Google Scholar]
- de Koff, S., Best, P., Baum, S. A., et al. 2000, ApJS, 129, 33 [NASA ADS] [CrossRef] [Google Scholar]
- Di Teodoro, E. M., & Fraternali, F. 2015, MNRAS, 451, 3021 [Google Scholar]
- Dutta, R., Gupta, N., Srianand, R., & O’Meara, J. M. 2016, MNRAS, 456, 4209 [NASA ADS] [CrossRef] [Google Scholar]
- Dutta, R., Srianand, R., Gupta, N., et al. 2017, MNRAS, 465, 588 [NASA ADS] [CrossRef] [Google Scholar]
- Emonts, B. H. C. 2006, PhD Thesis, University of Groningen, The Netherlands [Google Scholar]
- Fanaroff, B. L., & Riley, J. M. 1974, MNRAS, 167, 31P [Google Scholar]
- Fernández, X., Gim, H. B., van Gorkom, J. H., et al. 2016, ApJ, 824, L1 [NASA ADS] [CrossRef] [Google Scholar]
- Flewelling, H. A., Magnier, E. A., Chambers, K. C., et al. 2016, ArXiv e-prints [arXiv:1612.05243] [Google Scholar]
- Gillone, M., Capetti, A., & Rossi, P. 2016, A&A, 587, A25 [NASA ADS] [CrossRef] [EDP Sciences] [Google Scholar]
- Giovanelli, R., Haynes, M. P., Kent, B. R., et al. 2005a, AJ, 130, 2598 [NASA ADS] [CrossRef] [Google Scholar]
- Giovanelli, R., Haynes, M. P., Kent, B. R., et al. 2005b, AJ, 130, 2613 [NASA ADS] [CrossRef] [Google Scholar]
- Gogate, A. R., Verheijen, M. A. W., Deshev, B. Z., et al. 2020, MNRAS, 496, 3531 [CrossRef] [Google Scholar]
- Gupta, N., Srianand, R., Petitjean, P., Noterdaeme, P., & Saikia, D. J. 2009, MNRAS, 398, 201 [NASA ADS] [CrossRef] [Google Scholar]
- Gupta, N., Srianand, R., Bowen, D. V., York, D. G., & Wadadekar, Y. 2010, MNRAS, 408, 849 [NASA ADS] [CrossRef] [Google Scholar]
- Gupta, N., Srianand, R., Farnes, J. S., et al. 2018, MNRAS, 476, 2432 [NASA ADS] [CrossRef] [Google Scholar]
- Hardcastle, M. J., Croston, J. H., Shimwell, T. W., et al. 2019, MNRAS, 488, 3416 [NASA ADS] [CrossRef] [Google Scholar]
- Harwood, J. J., Hardcastle, M. J., Croston, J. H., & Goodger, J. L. 2013, MNRAS, 435, 3353 [NASA ADS] [CrossRef] [Google Scholar]
- Hess, K. M., Luber, N. M., Fernández, X., et al. 2019, MNRAS, 484, 2234 [CrossRef] [Google Scholar]
- Hewitt, A., & Burbidge, G. 1991, ApJS, 75, 297 [NASA ADS] [CrossRef] [Google Scholar]
- Holt, J., Tadhunter, C. N., González Delgado, R. M., et al. 2007, MNRAS, 381, 611 [NASA ADS] [CrossRef] [Google Scholar]
- Johnston, S., Taylor, R., Bailes, M., et al. 2008, Exp. Astron., 22, 151 [NASA ADS] [CrossRef] [Google Scholar]
- Jones, M. G., Haynes, M. P., Giovanelli, R., & Moorman, C. 2018, MNRAS, 477, 2 [NASA ADS] [CrossRef] [Google Scholar]
- Kanekar, N., & Briggs, F. H. 2004, New A Rev., 48, 1259 [CrossRef] [Google Scholar]
- Kanekar, N., Prochaska, J. X., Ellison, S. L., & Chengalur, J. N. 2009, MNRAS, 396, 385 [NASA ADS] [CrossRef] [Google Scholar]
- Kanekar, N., Prochaska, J. X., Smette, A., et al. 2014, MNRAS, 438, 2131 [NASA ADS] [CrossRef] [Google Scholar]
- Kennicutt, Jr., R. C. 1998, ApJ, 498, 541 [NASA ADS] [CrossRef] [Google Scholar]
- Kewley, L. J., Geller, M. J., Jansen, R. A., & Dopita, M. A. 2002, AJ, 124, 3135 [NASA ADS] [CrossRef] [Google Scholar]
- Koribalski, B. S., Staveley-Smith, L., Kilborn, V. A., et al. 2004, AJ, 128, 16 [NASA ADS] [CrossRef] [Google Scholar]
- Lal, D. V., & Rao, A. P. 2007, MNRAS, 374, 1085 [NASA ADS] [CrossRef] [Google Scholar]
- Leahy, J. P., Black, A. R. S., Dennett-Thorpe, J., et al. 1997, MNRAS, 291, 20 [NASA ADS] [Google Scholar]
- Matthews, T. A., Morgan, W. W., & Schmidt, M. 1964, ApJ, 140, 35 [NASA ADS] [CrossRef] [Google Scholar]
- McGaugh, S. S., Schombert, J. M., Bothun, G. D., & de Blok, W. J. G. 2000, ApJ, 533, L99 [NASA ADS] [CrossRef] [PubMed] [Google Scholar]
- Miller, B. P., & Brandt, W. N. 2009, ApJ, 695, 755 [NASA ADS] [CrossRef] [Google Scholar]
- Mirabel, I. F. 1989, ApJ, 340, L13 [NASA ADS] [CrossRef] [Google Scholar]
- Morganti, R., & Oosterloo, T. 2018, A&A Rv., 26, 4 [Google Scholar]
- Morganti, R., Oosterloo, T. A., Tinti, S., et al. 2002, A&A, 387, 830 [NASA ADS] [CrossRef] [EDP Sciences] [Google Scholar]
- Morganti, R., Tadhunter, C. N., & Oosterloo, T. A. 2005, A&A, 444, L9 [NASA ADS] [CrossRef] [EDP Sciences] [Google Scholar]
- Morganti, R., Fogasy, J., Paragi, Z., Oosterloo, T., & Orienti, M. 2013, Science, 341, 1082 [NASA ADS] [CrossRef] [Google Scholar]
- Murthy, S., Morganti, R., Oosterloo, T., et al. 2019, A&A, 629, A58 [NASA ADS] [CrossRef] [EDP Sciences] [Google Scholar]
- Odekon, M. C., Koopmann, R. A., Haynes, M. P., et al. 2016, ApJ, 824, 110 [NASA ADS] [Google Scholar]
- Oosterloo, T., & Shostak, S. 1993, A&AS, 99, 379 [NASA ADS] [Google Scholar]
- Oosterloo, T., Verheijen, M. A. W., van Cappellen, W., et al. 2009, Wide Field Astronomy & Technology for the Square Kilometre Array, 70 [Google Scholar]
- Parma, P., de Ruiter, H. R., & Cameron, R. A. 1991, AJ, 102, 1960 [NASA ADS] [CrossRef] [Google Scholar]
- Peng, C. Y., Ho, L. C., Impey, C. D., & Rix, H.-W. 2002, AJ, 124, 266 [Google Scholar]
- Peng, C. Y., Ho, L. C., Impey, C. D., & Rix, H.-W. 2010, AJ, 139, 2097 [NASA ADS] [CrossRef] [Google Scholar]
- Perley, R. A., & Butler, B. J. 2017, ApJS, 230, 7 [NASA ADS] [CrossRef] [Google Scholar]
- Pihlstrom, Y. M. 2001, Ph.D. Thesis, Chalmers University of Technology, Gothenburg, Sweden [Google Scholar]
- Planck Collaboration XVI. 2014, A&A, 571, A16 [NASA ADS] [CrossRef] [EDP Sciences] [Google Scholar]
- Reeves, S. N., Sadler, E. M., Allison, J. R., et al. 2015, MNRAS, 450, 926 [NASA ADS] [CrossRef] [Google Scholar]
- Reeves, S. N., Sadler, E. M., Allison, J. R., et al. 2016, MNRAS, 457, 2613 [NASA ADS] [CrossRef] [Google Scholar]
- Rogstad, D. H., Lockhart, I. A., & Wright, M. C. H. 1974, ApJ, 193, 309 [NASA ADS] [CrossRef] [Google Scholar]
- Saintonge, A., Catinella, B., Tacconi, L. J., et al. 2017, ApJS, 233, 22 [Google Scholar]
- Sancisi, R. 1976, A&A, 53, 159 [NASA ADS] [Google Scholar]
- Schmidt, M. 1965, ApJ, 141, 1 [NASA ADS] [CrossRef] [Google Scholar]
- Schulz, R., Morganti, R., Nyland, K., et al. 2018, A&A, 617, A38 [NASA ADS] [CrossRef] [EDP Sciences] [Google Scholar]
- Serra, P., Oosterloo, T., Morganti, R., et al. 2012, MNRAS, 422, 1835 [Google Scholar]
- Shimwell, T. W., Röttgering, H. J. A., Best, P. N., et al. 2017, A&A, 598, A104 [NASA ADS] [CrossRef] [EDP Sciences] [Google Scholar]
- Smith, E. P., & Heckman, T. M. 1989, ApJ, 341, 658 [NASA ADS] [CrossRef] [Google Scholar]
- Spekkens, K., Urbancic, N., Mason, B. S., Willman, B., & Aguirre, J. E. 2014, ApJ, 795, L5 [NASA ADS] [CrossRef] [Google Scholar]
- Srianand, R., Gupta, N., Petitjean, P., Noterdaeme, P., & Ledoux, C. 2010, MNRAS, 405, 1888 [NASA ADS] [Google Scholar]
- Srianand, R., Gupta, N., Rahmani, H., et al. 2013, MNRAS, 428, 2198 [NASA ADS] [CrossRef] [Google Scholar]
- Tadhunter, C. N., Villar-Martin, M., Morganti, R., Bland-Hawthorn, J., & Axon, D. 2000, MNRAS, 314, 849 [NASA ADS] [CrossRef] [Google Scholar]
- Tadhunter, C., Holt, J., González Delgado, R., et al. 2011, MNRAS, 412, 960 [NASA ADS] [Google Scholar]
- Tody, D. 1986, in The IRAF Data Reduction and Analysis System, ed. D. L. Crawford, SPIE Conf. Ser., 627, 733 [NASA ADS] [Google Scholar]
- van Breugel, W., Balick, B., Heckman, T., Miley, G., & Helfand, D. 1983, AJ, 88, 40 [CrossRef] [Google Scholar]
- van der Hulst, J. M. 1979, A&A, 71, 131 [NASA ADS] [Google Scholar]
- van der Hulst, J. M., Skillman, E. D., Kennicutt, R. C., & Bothun, G. D. 1987, A&A, 177, 63 [Google Scholar]
- van der Kruit, P. C., & Allen, R. J. 1978, ARA&A, 16, 103 [NASA ADS] [CrossRef] [Google Scholar]
- Verheijen, M., van Gorkom, J. H., Szomoru, A., et al. 2007, ApJ, 668, L9 [Google Scholar]
- Villar-Martín, M., Emonts, B., Cabrera Lavers, A., et al. 2017, MNRAS, 472, 4659 [NASA ADS] [CrossRef] [Google Scholar]
- Wang, J., Koribalski, B. S., Serra, P., et al. 2016, MNRAS, 460, 2143 [Google Scholar]
- Wright, M. C. H. 1971, Astrophys. Lett., 7, 209 [Google Scholar]
- Zwaan, M. A., van Dokkum, P. G., & Verheijen, M. A. W. 2001, Science, 293, 1800 [NASA ADS] [CrossRef] [Google Scholar]
All Tables
All Figures
|
Fig. 1. Left panel: optical image of 3C 433 environment from GTC is shown in the background. Black contours show the radio continuum at 1.12 GHz as observed with the VLA. Contours start from 4σ (13 mJy beam−1) and increase by a factor of 2. Our VLA radio image has a beam of 5.39″ × 4.72″, shown in the bottom right corner. Blue contours show the 3.6 cm map by Black et al. (1992). Contour levels start from 30 μJy beam−1 (3σ) and increase by a factor of two. The region in the white box is blown up in the two images on the right panel. The radio core of 3C 433 as identified by van Breugel et al. (1983) is marked with a black cross. Right panel (bottom): blow-up of the image in the left panel with the H I column density (NHI) contours shown in white. The NHI contours start from 0.7 × 10¹⁸(Tspin/f) cm−2 and increase in steps of 0.3 × 10¹⁸(Tspin/f) cm−2. The image clearly shows that the H I absorber overlaps with an optical galaxy. Right panel (top): Hα contours (from GTC) overlaid on the optical image. The Hα contours levels are: (2.7, 3.2, 3.7, 4.3, 4.9, 5.4, 6 and 6.4) × 10−18 erg s−1 cm−2. The 3.6 cm radio contours (same as that in the left panel) are shown in blue. |
| In the text | |
|
Fig. 2. GTC imaging of the galaxy at the location of the H I absorption. Shown: the r-band continuum image (left), the narrow-band image with both Hα and continuum included (middle), and the continuum-subtracted Hα image (right). The galaxy is indicated by the black arrow in each panel. The details on these images are given in Sect. 3. |
| In the text | |
|
Fig. 3. Integrated H I absorption spectrum from the VLA. The spectrum has been shifted to the restframe of 3C 433 i.e. z = 0.1016 ± 0.0001. We see that the peak absorption is only ∼50 km s−1 blueshifted with respect to the systemic velocity of 3C 433. The VLA spectral cube has an RMS noise of 1.2 mJy beam−1 and a velocity resolution of 12.5 km s−1. |
| In the text | |
|
Fig. 4. H I absorption velocity field with the contours of the radio continuum of 3C 433 (from the VLA observations) overlaid. Contour levels and the beam (shown in the bottom right corner) are as in Fig. 1. |
| In the text | |
|
Fig. 5. H I position-velocity diagram of the absorber galaxy extracted along the major axis of the H I absorption (i.e. ∼63°, visually determined). Contour levels are: 3.5, 7.3, 11.7, 16.0, and 20.4 mJy beam−1. The systemic velocity of 3C 433 is 30458.9 km s−1. |
| In the text | |
|
Fig. 6. Hα image of 3C433 and its environment. Left: low surface-brightness emission in the circum-galactic environment of 3C 433, showing the companion galaxy to the south and several Hα emitting regions. The white dots are mostly the residuals of saturated foreground stars that could not be accurately subtracted. The black and dark blue contours show the low- and high-resolution VLA radio continuum images previously shown in Fig. 1. The contour levels are at 0.2, 0.5, 1.0, 1.5, 2.0 mJy beam−1 for the high-resolution data (blue) and 15, 60, 700 mJy beam−1 for the low-resolution data (black). Light blue contours highlight the Hα emission shown in more detail on the right-hand side. The contour levels are at 4.3, 6.4, 12.8, 25.7, 47 percent of the peak intensity. Light-blue dashed line visualizes the direction perpendicular to the Hα structure in the center. Right: Hα emission in the central radio galaxy, shown at two different contrasts. |
| In the text | |
|
Fig. 7. HST image of [OIII] detected with filter FR533N18 centered at 5515.7 Å (νrest = 5007 Å). Overlaid are the contours of our Hα image (light blue) and VLA radio continuum (dark blue) from Fig. 6. The Hα emission follows the [OIII] emission, which, in turn, traces the outline of the inner radio jet. |
| In the text | |
|
Fig. 8. Surface brightness profile of the absorber galaxy. For representation, we limit this to one effective radius. See Sect. 3 for details. |
| In the text | |
|
Fig. 9. SFR−M* plane for xCOLD GASS sample from Saintonge et al. (2017) with our H I absorbing galaxy marked in blue rectangle (colour-coded on the atomic gas fraction). The black dots represent H I non-detections in their sample while the grey contours represents the distribution of the SDSS galaxy population. The absorber galaxy is marked in a rectangle to represent the range of SFR derived; see Sect. 3.2 for details. The fH I, which corresponds to the ratio between MHI and (M* + MHI), for our H I absorber galaxy ranges between –1.1 and –2.1 (in logscale) for a Tspin of 1000 K and 100 K respectively. For plotting, we consider a Tspin of 1000 K. ©AAS. Reproduced with permission. |
| In the text | |
Current usage metrics show cumulative count of Article Views (full-text article views including HTML views, PDF and ePub downloads, according to the available data) and Abstracts Views on Vision4Press platform.
Data correspond to usage on the plateform after 2015. The current usage metrics is available 48-96 hours after online publication and is updated daily on week days.
Initial download of the metrics may take a while.