Fig. 9.
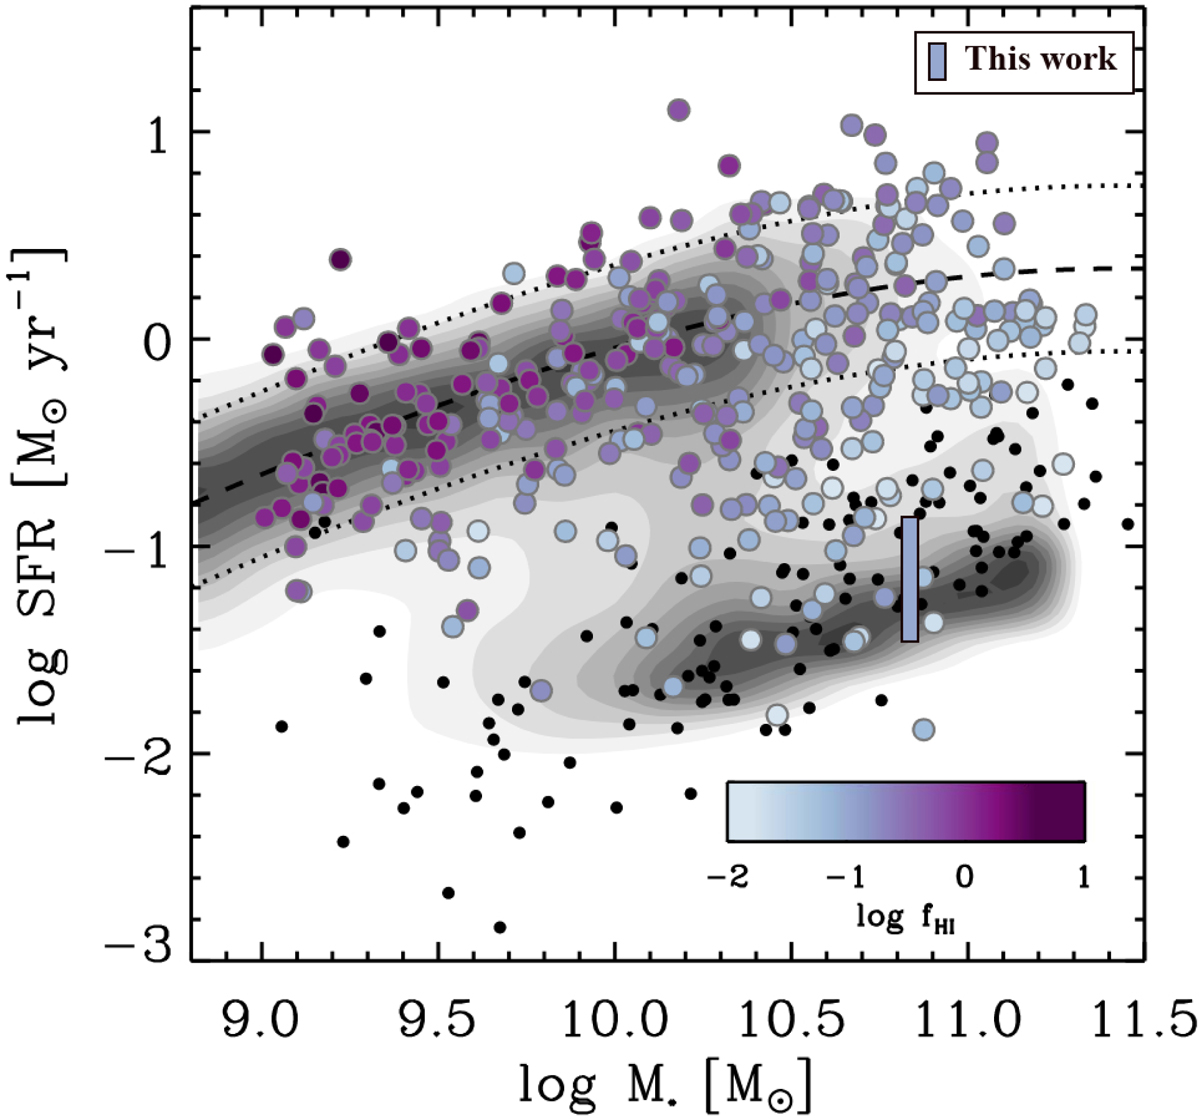
SFR−M* plane for xCOLD GASS sample from Saintonge et al. (2017) with our H I absorbing galaxy marked in blue rectangle (colour-coded on the atomic gas fraction). The black dots represent H I non-detections in their sample while the grey contours represents the distribution of the SDSS galaxy population. The absorber galaxy is marked in a rectangle to represent the range of SFR derived; see Sect. 3.2 for details. The fH I, which corresponds to the ratio between MHI and (M* + MHI), for our H I absorber galaxy ranges between –1.1 and –2.1 (in logscale) for a Tspin of 1000 K and 100 K respectively. For plotting, we consider a Tspin of 1000 K. ©AAS. Reproduced with permission.
Current usage metrics show cumulative count of Article Views (full-text article views including HTML views, PDF and ePub downloads, according to the available data) and Abstracts Views on Vision4Press platform.
Data correspond to usage on the plateform after 2015. The current usage metrics is available 48-96 hours after online publication and is updated daily on week days.
Initial download of the metrics may take a while.