Free Access
Fig. 7.
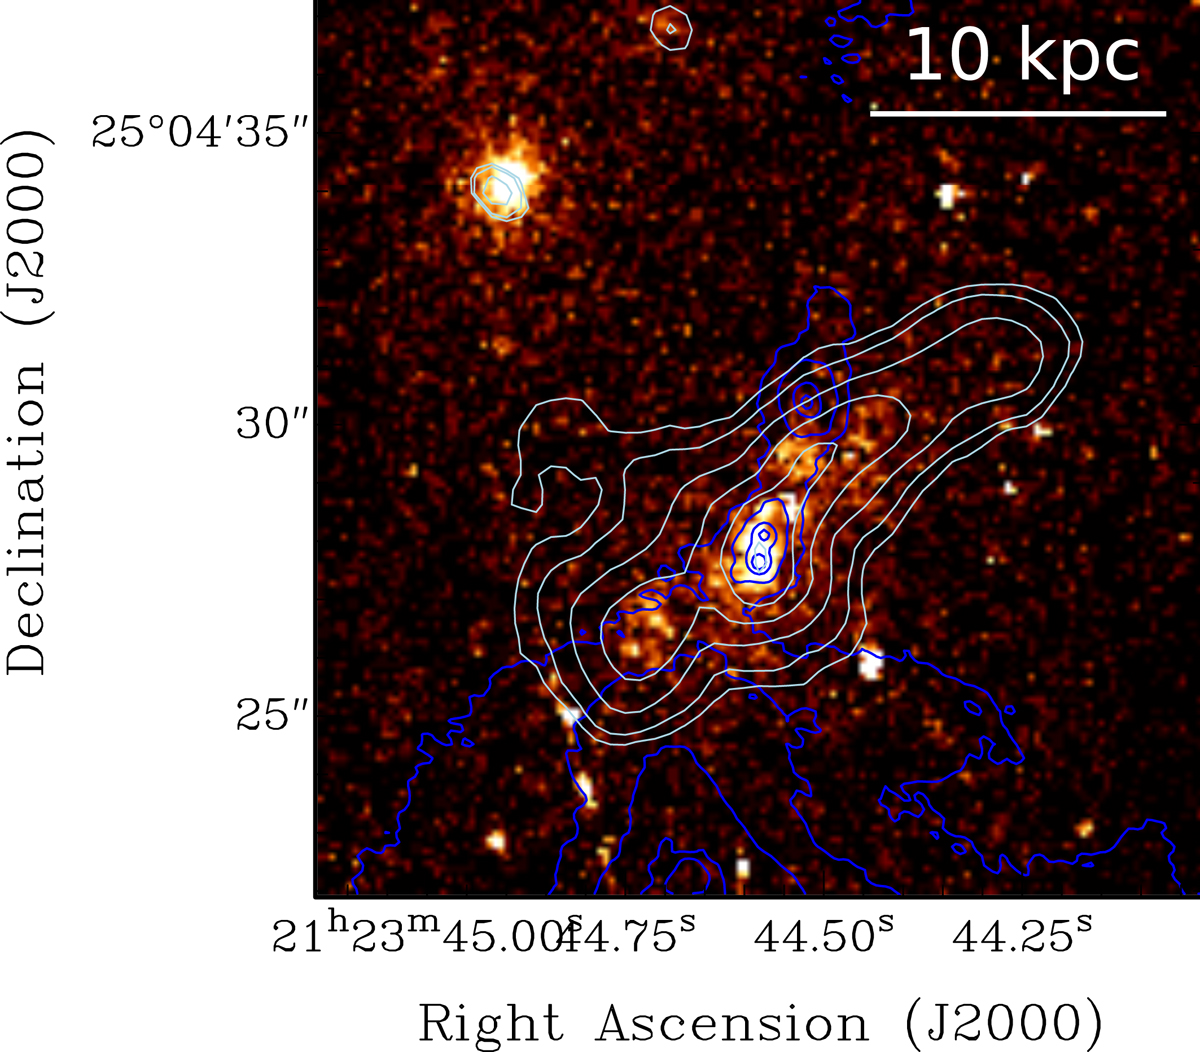
HST image of [OIII] detected with filter FR533N18 centered at 5515.7 Å (νrest = 5007 Å). Overlaid are the contours of our Hα image (light blue) and VLA radio continuum (dark blue) from Fig. 6. The Hα emission follows the [OIII] emission, which, in turn, traces the outline of the inner radio jet.
Current usage metrics show cumulative count of Article Views (full-text article views including HTML views, PDF and ePub downloads, according to the available data) and Abstracts Views on Vision4Press platform.
Data correspond to usage on the plateform after 2015. The current usage metrics is available 48-96 hours after online publication and is updated daily on week days.
Initial download of the metrics may take a while.