Fig. 6
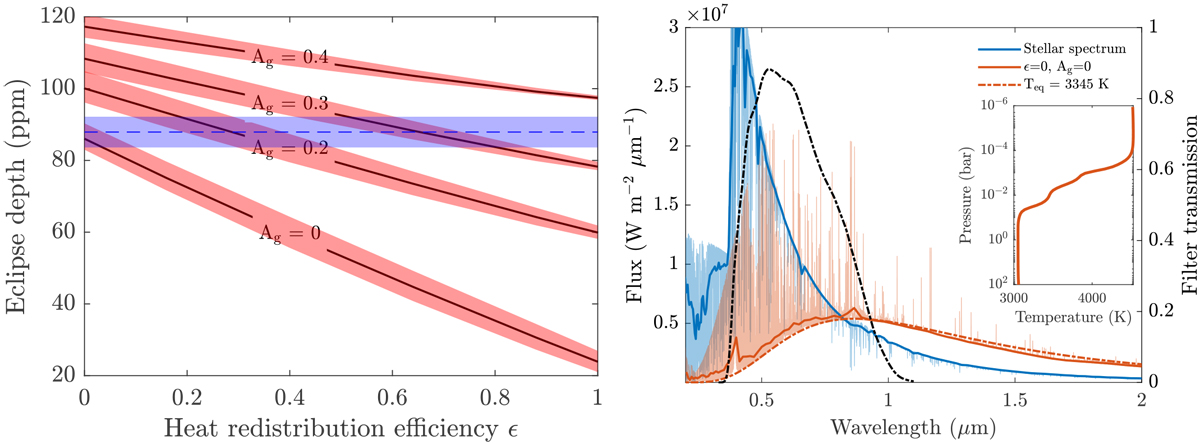
Left panel: calculated (curves) versus measured (shaded horizontal region) occultation depths as functions of the heat redistribution efficiency. Different curves with assumed values of Ag are shown. As a sensitivity test, the shaded region associated with each curve corresponds to a variation in metallicity within a range of [M∕H] = 0.2 ± 0.3. Right panel: theoretical spectral energy distribution, at a low and high resolution of the star (blue curve) with the CHEOPS bandpass (black dot-dashed curve) overlaid. The model for WASP-189 b (with Ag = ɛ = 0) is overlaid in orange, with the corresponding temperature–pressure profile shown in the inset. For comparison, a blackbody curve with a temperature of 3345 K is also overlaid (orange dashed line).
Current usage metrics show cumulative count of Article Views (full-text article views including HTML views, PDF and ePub downloads, according to the available data) and Abstracts Views on Vision4Press platform.
Data correspond to usage on the plateform after 2015. The current usage metrics is available 48-96 hours after online publication and is updated daily on week days.
Initial download of the metrics may take a while.