Fig. 8.
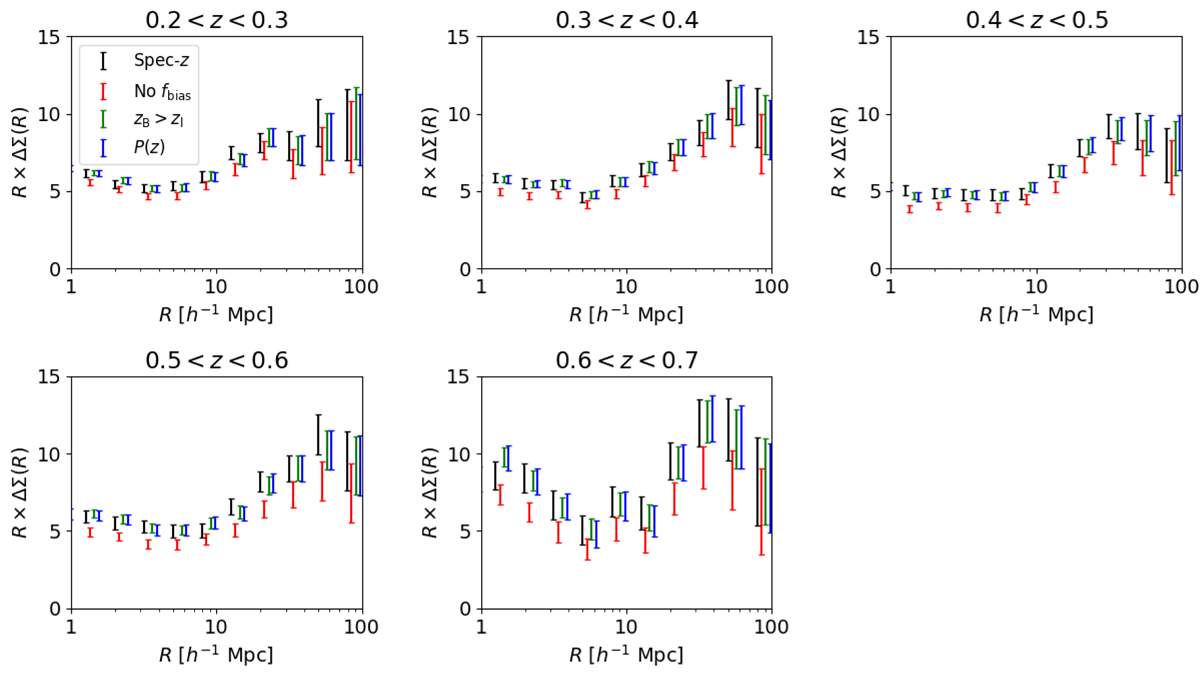
Measurements of the projected mass density ΔΣ for each lens redshift slice of the MICE mocks, where measurements corresponding to the different source tomographic samples have been optimally combined following the procedure described in Appendix C. Results are shown for four cases: using the spectroscopic redshifts of the sources (black points, fiducial measurement with perfect source redshifts), using the photometric redshifts of the sources but without a correction for the photo-z dilution factor fbias (red points, photo-z dilution remains uncorrected), including the dilution correction (green points), and using the redshift probability distribution for each source tomographic slice (blue points). We only include individual source-lens pairs with zB > zl in the measurement. We find that, other than for the case where the fbias correction is excluded, both the point-based and distribution-based photo-z dilution corrections produce ΔΣ measurements which are consistent with those obtained using the source spectroscopic redshifts.
Current usage metrics show cumulative count of Article Views (full-text article views including HTML views, PDF and ePub downloads, according to the available data) and Abstracts Views on Vision4Press platform.
Data correspond to usage on the plateform after 2015. The current usage metrics is available 48-96 hours after online publication and is updated daily on week days.
Initial download of the metrics may take a while.