Fig. 7.
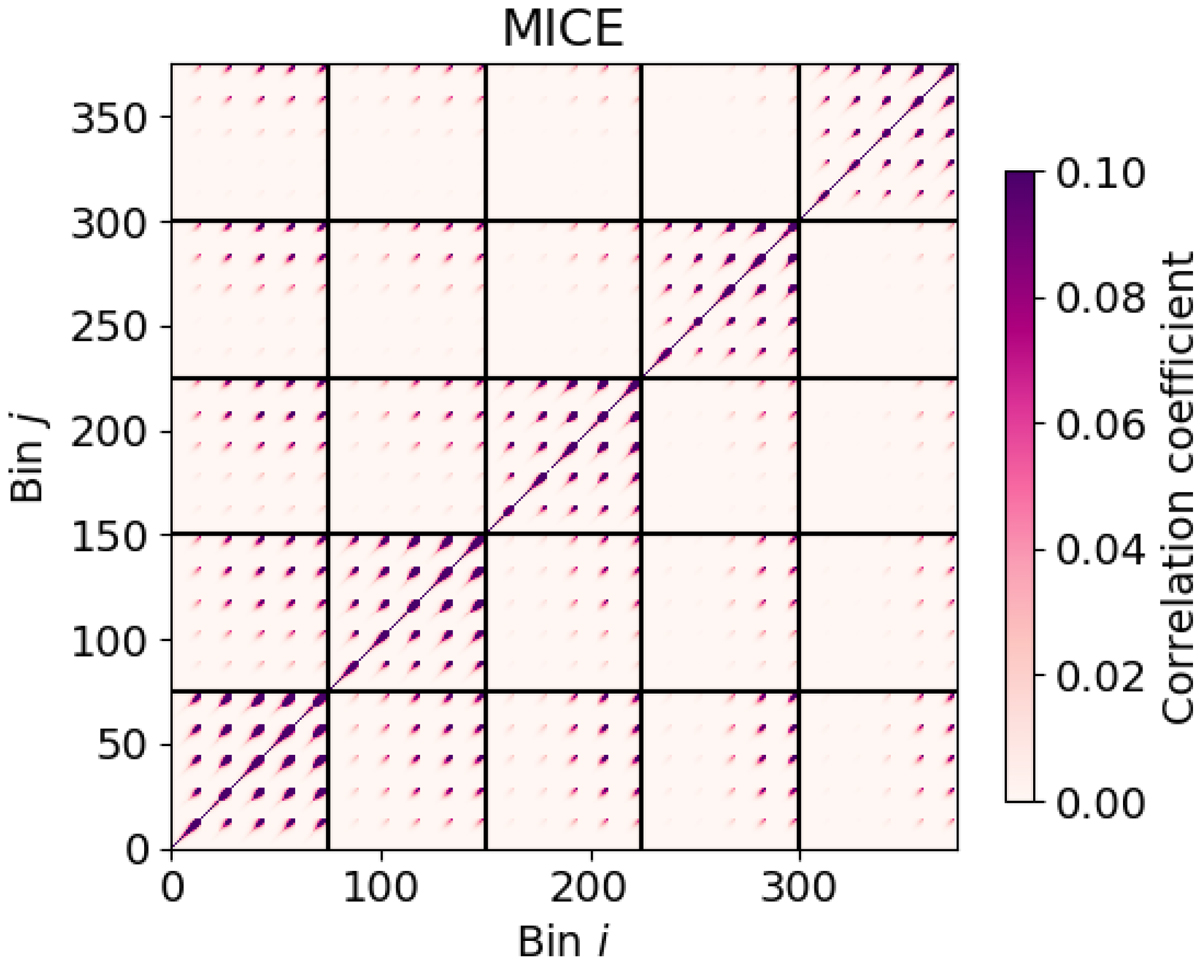
Full analytical covariance matrix Cij of the projected mass density ΔΣ(R) for the MICE mocks, spanning five lens redshift slices, five source tomographic samples and 15 bins of scale – i.e. 375 × 375 entries – ordered where each subsequent bin changes separation, then source sample, then lens sample, such that the vertical and horizontal solid lines demarcate different lens redshift slices. We display the results as a correlation matrix ![]() , and note that there are significant off-diagonal correlations between measurements utilising the same lens or source sample, and between different scales. We note that the colour bar is saturated at r = 0.1 to reveal low-amplitude cross-correlation more clearly.
, and note that there are significant off-diagonal correlations between measurements utilising the same lens or source sample, and between different scales. We note that the colour bar is saturated at r = 0.1 to reveal low-amplitude cross-correlation more clearly.
Current usage metrics show cumulative count of Article Views (full-text article views including HTML views, PDF and ePub downloads, according to the available data) and Abstracts Views on Vision4Press platform.
Data correspond to usage on the plateform after 2015. The current usage metrics is available 48-96 hours after online publication and is updated daily on week days.
Initial download of the metrics may take a while.