Fig. 6.
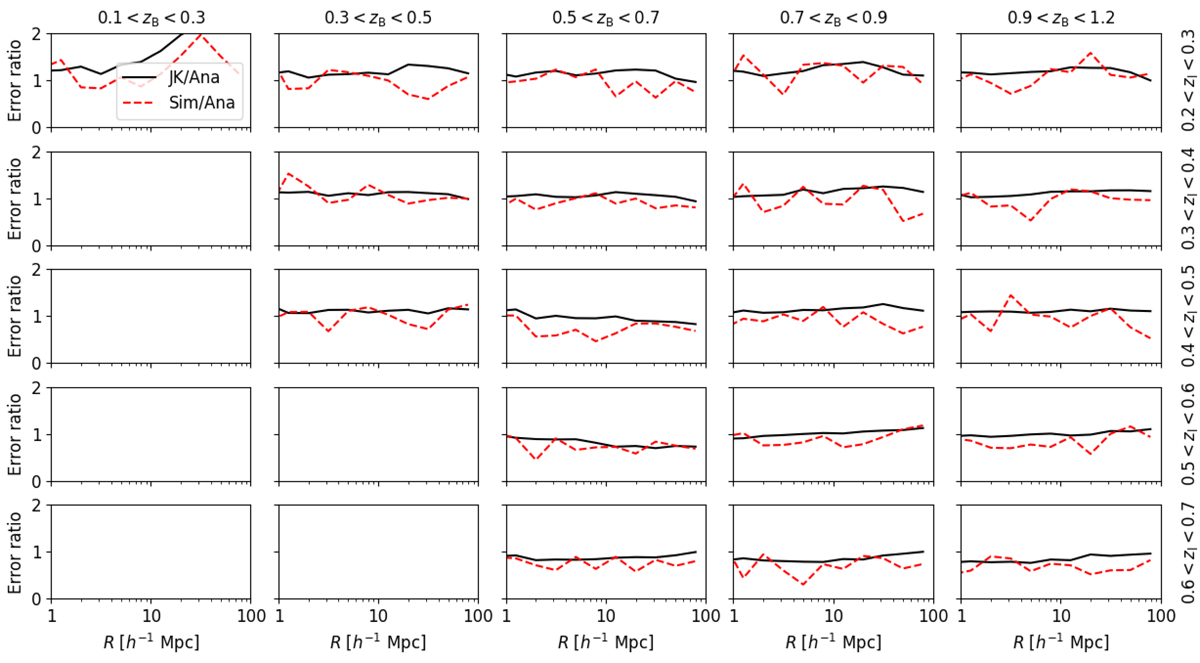
Comparison of different estimates of the error in ΔΣ(R) for individual 516 deg2 realisations of the MICE mocks, between all pairs of lens spectroscopic redshift slices (rows) and source tomographic samples (columns). The black solid line shows the ratio between the error determined by a jack-knife analysis of the data and the error derived from the diagonal elements of the analytical covariance matrix, and the red dashed line is the ratio between the standard deviation across 10 realisations and the analytical error. No measurements are possible for the lower left-hand set of panels, owing to the adopted cut in source-lens pairs, zB > zl.
Current usage metrics show cumulative count of Article Views (full-text article views including HTML views, PDF and ePub downloads, according to the available data) and Abstracts Views on Vision4Press platform.
Data correspond to usage on the plateform after 2015. The current usage metrics is available 48-96 hours after online publication and is updated daily on week days.
Initial download of the metrics may take a while.