Fig. 5.
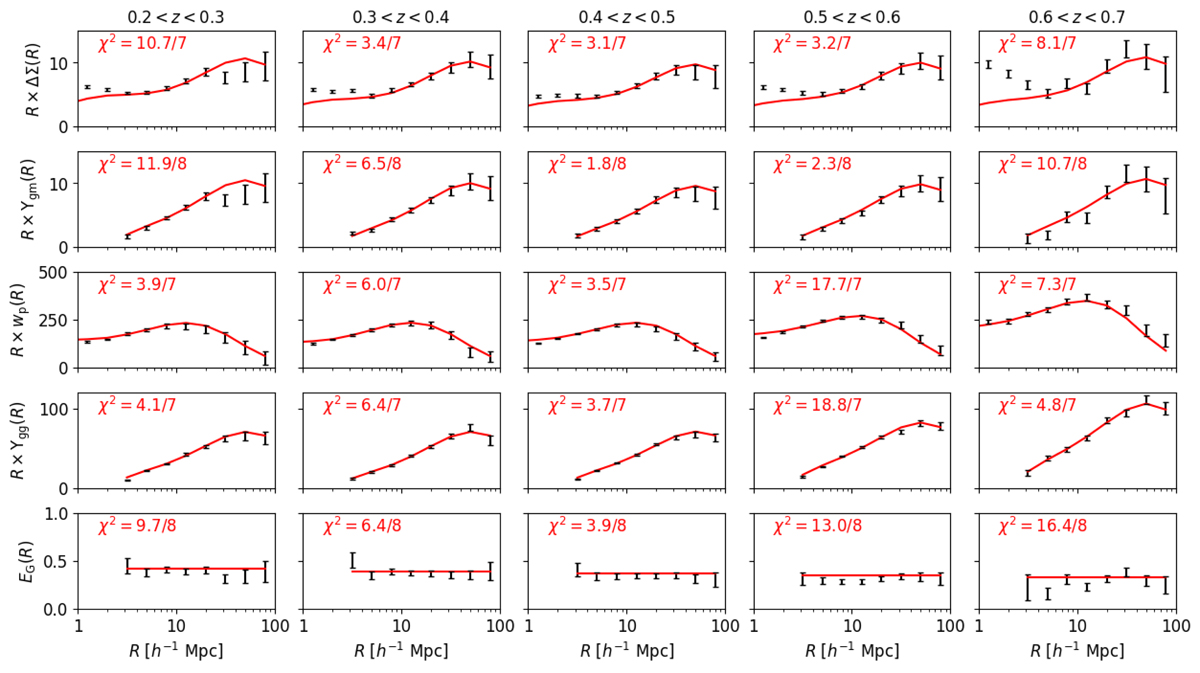
Measurements of a series of galaxy-galaxy lensing and clustering statistics (rows) for each different lens redshift slice (columns) of the MICE mocks. The first row displays the projected mass density ΔΣ(R), where measurements corresponding to the different source tomographic samples have been optimally combined following the procedure described in Appendix C. The second row shows the corresponding measurements of Υgm(R), derived from ΔΣ(R) using Eq. (40) and assuming R0 = 2 h−1 Mpc. The third and fourth rows display the galaxy clustering statistics wp(R) and Υgg(R) for each lens redshift slice, where wp(R) is the projected correlation function measurement, and Υgg(R) is the associated quantity suppressing contributions from small scales, derived using Eq. (41) and again assuming R0 = 2 h−1 Mpc. The fifth row shows the combined-probe statistic EG(R), derived from the Υgm(R) and Υgg(R) measurements using Eq. (44). Errors are displayed using the diagonal elements of the analytical covariance matrix, propagating errors where appropriate. The overplotted models are determined using the galaxy bias factors fitted to the Υgg measurements for each lens redshift slice, and χ2 statistics between the mock mean data and model are displayed in each panel.
Current usage metrics show cumulative count of Article Views (full-text article views including HTML views, PDF and ePub downloads, according to the available data) and Abstracts Views on Vision4Press platform.
Data correspond to usage on the plateform after 2015. The current usage metrics is available 48-96 hours after online publication and is updated daily on week days.
Initial download of the metrics may take a while.