Fig. 3.
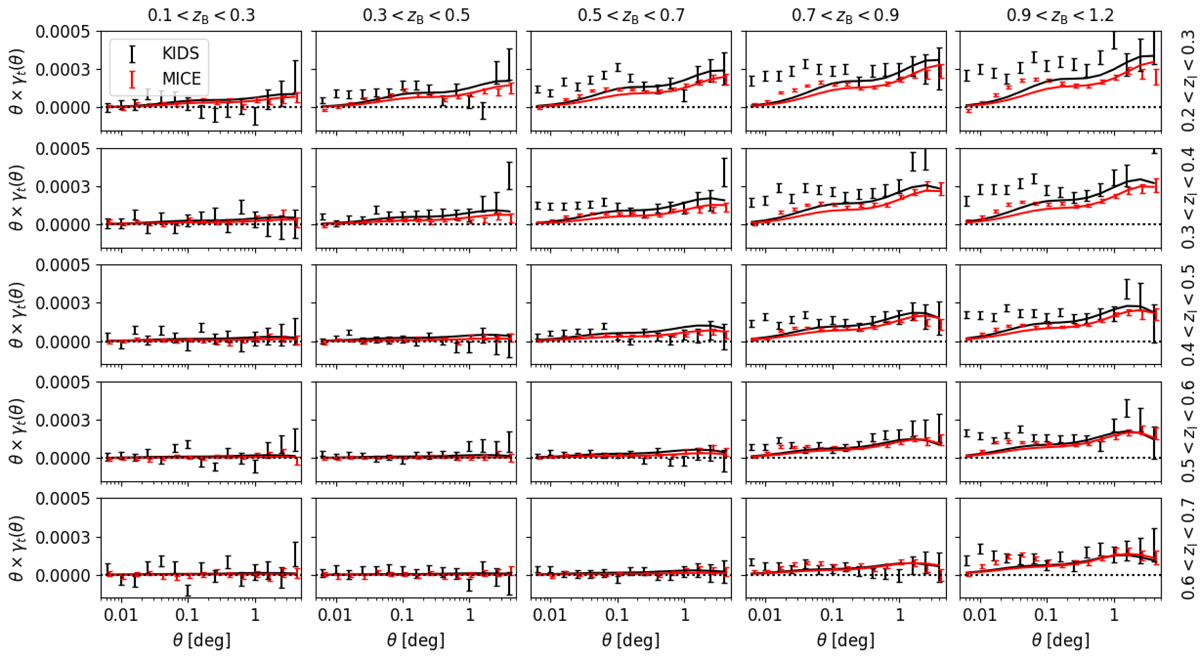
Measurements of the average tangential shear, γt(θ), for the KiDS-LRG dataset (black points) and representative MICE mocks (red points), between all pairs of lens spectroscopic redshift slices (rows) and source tomographic samples split by photometric redshift (columns). The errors are derived from the diagonal elements of the full analytical covariance matrix (where we note that measurements are correlated across scales and samples). The overplotted model is not a fit to this dataset, but rather a prediction based on the galaxy bias parameter fits to the Υgg statistic of each lens redshift slice, which is inaccurate on small scales. The y-values are scaled by a factor of θ (in degrees) for clarity.
Current usage metrics show cumulative count of Article Views (full-text article views including HTML views, PDF and ePub downloads, according to the available data) and Abstracts Views on Vision4Press platform.
Data correspond to usage on the plateform after 2015. The current usage metrics is available 48-96 hours after online publication and is updated daily on week days.
Initial download of the metrics may take a while.