Fig. 2.
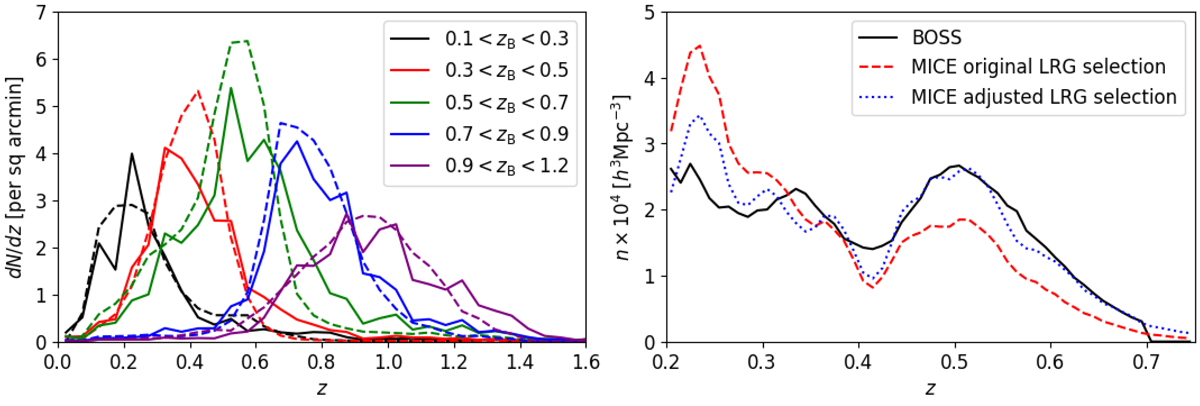
Left panel: redshift distribution estimates of the KiDS source catalogue (solid lines) and MICE mock source catalogue (dashed lines) in the five source tomographic bins split by photometric redshift. Right panel: number density as a function of redshift of the BOSS LRG dataset (black solid line), the MICE mock lens catalogue with the original BOSS colour selection (red dashed line), and the MICE mock lens catalogue with the adjusted BOSS colour selection (blue dotted line).
Current usage metrics show cumulative count of Article Views (full-text article views including HTML views, PDF and ePub downloads, according to the available data) and Abstracts Views on Vision4Press platform.
Data correspond to usage on the plateform after 2015. The current usage metrics is available 48-96 hours after online publication and is updated daily on week days.
Initial download of the metrics may take a while.