Fig. 13.
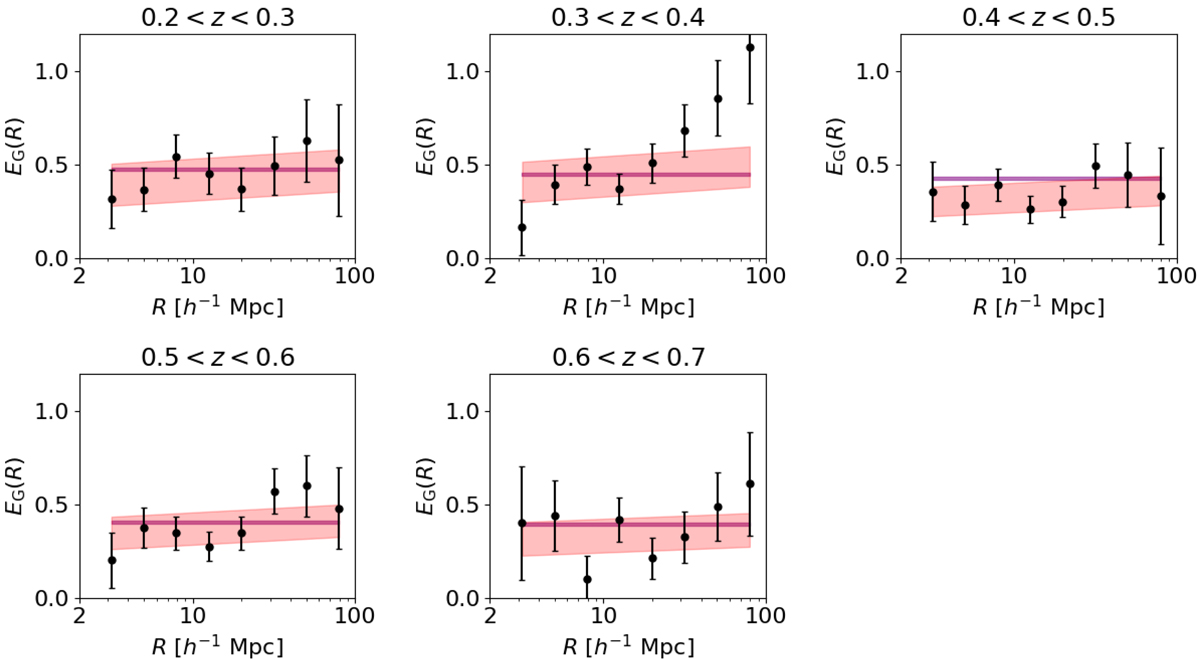
Measurements of the EG(R) statistic for the KiDS-1000 source sample in each LRG lens redshift slice. Errors are derived from the diagonal elements of the analytical covariance matrix, propagating errors where appropriate. The thickness of the purple horizontal stripes illustrates the 68% confidence range of the prediction of the Planck “TTTEEE+lowE+lensing” parameter chain at each redshift assuming a flat ΛCDM Universe, and the red bands illustrate the 68% confidence ranges of a scale-dependent model EG(R, zi) = Ai[1+α log10(R)] discussed in Sect. 9.3.
Current usage metrics show cumulative count of Article Views (full-text article views including HTML views, PDF and ePub downloads, according to the available data) and Abstracts Views on Vision4Press platform.
Data correspond to usage on the plateform after 2015. The current usage metrics is available 48-96 hours after online publication and is updated daily on week days.
Initial download of the metrics may take a while.