Fig. 12.
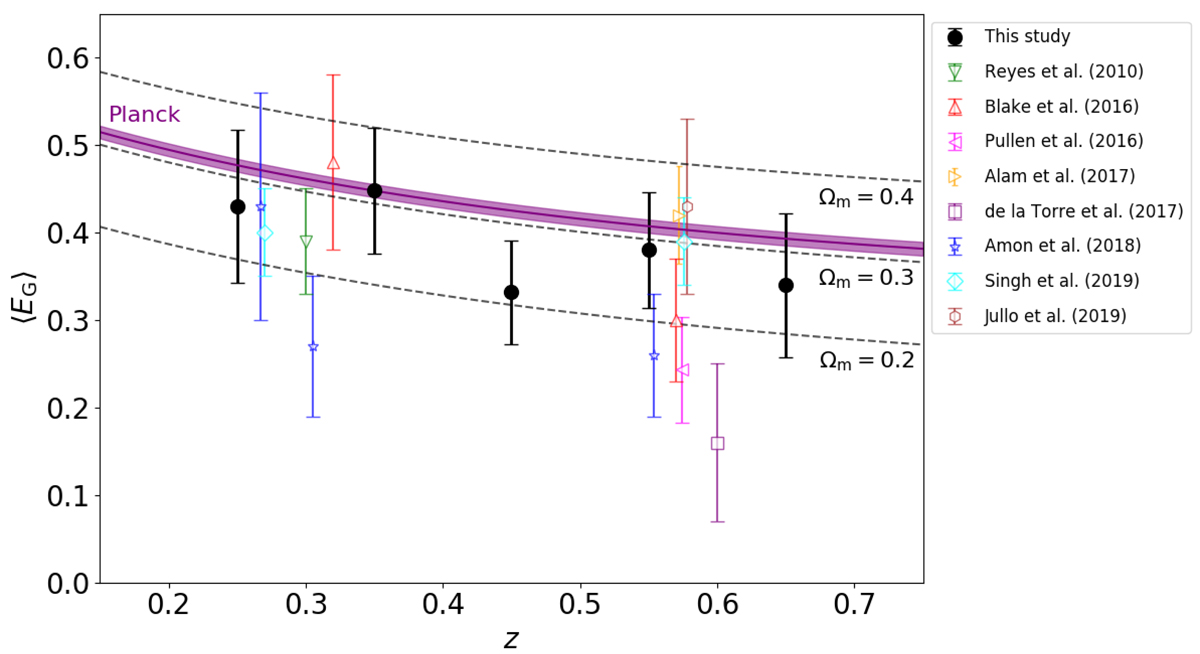
Compilation of measurements of a scale-independent ⟨EG⟩ as a function of redshift. The solid black data points illustrate the results of this study, in five redshift bins. These are compared to literature values from: Reyes et al. (2010) (green), Blake et al. (2016b) (red), Pullen et al. (2016) (magenta), Alam et al. (2017b) (orange), de la Torre et al. (2017) (purple), Amon et al. (2018) (blue), Singh et al. (2019) (cyan) and Jullo et al. (2019) (brown). We note that these previous measurements typically correspond to significantly wider lens redshift ranges than our study, and are also correlated in some cases owing to overlapping datasets. The thickness of the purple shaded stripe illustrates the 68% confidence range of the prediction of the Planck “TTTEEE+lowE+lensing” parameter chain at each redshift assuming a flat ΛCDM Universe, and the dashed lines are the predictions of the model EG(z) = Ωm/f(z) for Ωm = [0.2, 0.3, 0.4].
Current usage metrics show cumulative count of Article Views (full-text article views including HTML views, PDF and ePub downloads, according to the available data) and Abstracts Views on Vision4Press platform.
Data correspond to usage on the plateform after 2015. The current usage metrics is available 48-96 hours after online publication and is updated daily on week days.
Initial download of the metrics may take a while.