| Issue |
A&A
Volume 642, October 2020
|
|
|---|---|---|
| Article Number | A91 | |
| Number of page(s) | 17 | |
| Section | Stellar structure and evolution | |
| DOI | https://doi.org/10.1051/0004-6361/202038065 | |
| Published online | 09 October 2020 | |
Asteroseismology of two Kepler detached eclipsing binaries
Institute for Astronomy, Astrophysics, Space Applications and Remote Sensing, National Observatory of Athens, Metaxa & Vas. Pavlou St., 15236 Penteli, Athens, Greece
e-mail: This email address is being protected from spambots. You need JavaScript enabled to view it.
Received:
1
April
2020
Accepted:
3
August
2020
Abstract
The present work contains light curve, spectroscopic, and asteroseismic analyses for KIC 04851217 and KIC 10686876. These systems are detached eclipsing binaries hosting a pulsating component of δ Scuti type and have been observed with the unprecedented accuracy of the Kepler space telescope. Using ground-based spectroscopic observations, the spectral types of the primary components of the systems were estimated as A6V and A5V for KIC 04851217 and KIC 10686876, respectively, with an uncertainty of one subclass. The present spectral classification, together with literature radial velocity curves, were used to model the light curves of the systems and, therefore, to calculate the absolute parameters of their components with a higher degree of certainty. The photometric data were analysed using standard eclipsing binary modeling techniques, while their residuals were further analysed using Fourier transformation techniques to extract the pulsation frequencies of their host δ Scuti stars. The oscillation modes of the independent frequencies were identified using theoretical models of δ Scuti stars. The distances of the systems were calculated using the relation between the luminosity and the pulsation period for δ Scuti stars. Here, the physical and the oscillation properties of the pulsating components of these systems are discussed and compared with others of the same type. Moreover, using all the currently known cases of δ Scuti stars in detached binaries, updated correlations between orbital and dominant pulsation periods and between log g and pulsation periods are derived. It can concluded that the proximity of the companion plays significant role in the evolution of the pulsational frequencies.
Key words: asteroseismology / binaries: close / binaries: eclipsing / stars: oscillations / stars: fundamental parameters / stars: variables: δ Scuti
© ESO 2020
1. Introduction
The δ Scuti stars are fast and multiperiodic oscillating variables. They pulsate in radial and low-order non-radial pulsations due to κ-mechanism (cf. Aerts et al. 2010; Balona et al. 2015). They also pulsate in high-order non-radial modes which may be attributed to the turbulent pressure in the hydrogen convective zone, as suggested by Antoci et al. (2014) and Grassitelli et al. (2015). They have masses between 1.5 and 2.5 M⊙ (Aerts et al. 2010), their spectral types range between A-F, and they extend from the main-sequence dwarfs up to giants lying mostly inside the classical instability strip. Uytterhoeven et al. (2011) used a sample of 750 A-F type stars, observed by the Kepler mission (Borucki et al. 2010; Koch et al. 2010), and found that 63% are either δ Scuti or γ Doradus, or hybrid stars. Bowman & Kurtz (2018), based on two large Kepler ensembles of δ Scuti stars, explored the relations between their pulsational and stellar parameters, as well as their distribution within the classical instability strip. Ziaali et al. (2019) determined a period-luminosity relation for δ Scuti stars using Gaia parallaxes (Gaia Collaboration 2016), assuming that their dominant oscillation mode is radial. Murphy et al. (2019), using Gaia DR2 parallaxes of 15 000 A-F stars and their respective Kepler light curves, derived a sample of 2000 genuine δ Scuti stars, based on which they recalculated the boundaries of the classical instability strip on the Hertzsprung-Russell diagram. Antoci et al. (2019) published the first asteroseismic results for δ Scuti and γ Doradus stars observed by the Transiting Exoplanet Survey Satellite mission (TESS; Ricker et al. 2009, 2015). Jayasinghe et al. (2020) identified approximately 8400 δ Scuti stars among the data of the All-Sky Automated Survey for Supernovae (ASAS-SN; Shappee et al. 2014) and, by using distances from Gaia DR2 parallaxes, derived pulsation period-luminosity relations for pulsators that oscillate in fundamental and overtone modes in specific wavelength bands.
The eclipsing binaries (EBs) can serve as the ultimate tools for the estimation of the physical parameters (e.g. masses, radii, luminosities) and the evolutionary status of their components, especially when their light curves (LCs) and radial velocity curves (RVs) are combined in the analysis. Moreover, another powerful tool of the EBs is the eclipse timing variations (ETV) method, which allows for the detection of orbital period modulating mechanisms (e.g. mass transfer, tertiary component, etc).
The topic of δ Scuti stars in EBs is also interesting in that it includes two entirely different astrophysical subjects. Specifically, it combines the light variability due to geometric effects (i.e. eclipses) with the intrinsic variability due to oscillations of the stellar interior and atmosphere. Therefore, in general, the pulsating stars in EBs are extremely important because their absolute parameters and their pulsating properties can be directly derived and compared with the respective theoretical models in order to check the validity of the stellar evolution theory. Moreover, the study of cases of close binaries (i.e. short-period EBs) with strong interactions and mass transfer opens up a new path for the exploration of the influence of the proximity effects due to binarity in the stellar interiors.
Mkrtichian et al. (2002) introduced the term “oEA stars” (oscillating eclipsing binaries of Algol type) for characterising the EBs with a δ Scuti mass accretor component of (B)A-F spectral type. The influence of mass accretion to the pulsational behaviour is one of the major questions in this particular topic of Asteroseismology and it has inspired a great deal of discussion to date (e.g. Tkachenko et al. 2009; Mkrtichian et al. 2018; Bowman et al. 2019). Soydugan et al. (2006a) announced the first connection between orbital (Porb) and dominant pulsation (Ppul) periods for systems hosting a δ Scuti member. Liakos et al. (2012), following a six-year observational survey, published a catalogue including 74 cases and updated correlations between fundamental parameters. Zhang et al. (2013) made the first theoretical attempt for the Ppul − Porb correlation. Liakos & Niarchos (2015, 2016) noted, for the first time, a possible boundary between Ppul − Porb beyond which these two quantities can be considered uncorrelated (Porb ∼ 13 d). Liakos & Niarchos (2017) published the most complete catalogue for these systems to date (available online1), which also includes updated correlations between fundamental parameters according to the geometrical status of the systems and the accuracy of their absolute parameters. A few months later, Kahraman Aliçavuş et al. (2017) almost doubled the threshold of Porb by taking into account only the eclipsing systems. Murphy (2018) published a review for binaries with pulsating components, also including those with δ Scuti members. Qian et al. (2018), using the LAMOST spectra of more than 760 δ Scuti stars, found that 88 of them are possibly members of binary or multiple systems.
The Kepler (Borucki et al. 2010; Koch et al. 2010) and K2 (Howell et al. 2014) missions are generally considered benchmarks for asteroseismology, although the former was initially designed for exoplanet transits. These missions have offered a great amount of highly accurate data (on the order of tenths of mmag), allowing for the detection of extremely low-amplitude frequencies (on the order of a few μmag; Murphy et al. 2013; Bowman & Kurtz 2018). Moreover, the continuous recording of the targets eliminates the alias effects that are produced from the ground-based nightly operated telescopes (Breger 2000). The time resolutions (short cadence ∼1 min; long cadence ∼30 min) of these space missions are extremely useful for the study of both EBs as well as short- and long-period pulsating stars. The easy access to the publicly available data from the Kepler mission provided the means for astronomers to work across different topics at the same time. Especially with regard to the EBs, a database hosting all the identified cases, namely the Kepler Eclipsing Binary Catalog2 (KEBC, Prša et al. 2011), has been developed and provides the detrended data and preliminary information (e.g. ephemerides, magnitudes, temperatures) for a few thousands of EBs.
The catalogue of Liakos & Niarchos (2017) includes 17 cases of Kepler EBs with a δ Scuti component. However, today, this sample has tripled. In particular, to date, a total of eight oEA stars, 25 detached systems, and 19 systems with unclassified Roche geometry have been published. All these systems are listed in Table 1, along with their type of variability (ToV) and a corresponding reference, while their demographics are shown in Fig. 1. For the majority of these systems (i.e. the eclipsing and the ellipsoidal cases), the absolute parameters of the pulsating component(s) have been calculated using either LCs only or both LCs and RVs.
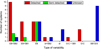 |
Fig. 1. Demographics of the published cases of binaries with a δ Scuti component observed by the Kepler and K2 missions according to their Roche geometry and type of variability. |
Known cases of binaries with a δ Scuti component observed by the Kepler and K2 missions categorised according to their Roche geometry.
The present paper is a continuation of the systematic study on EBs with a δ Scuti component (see also Liakos & Niarchos 2009, 2013, 2016; Liakos & Cagaš 2014; Liakos 2017, 2018) and aims to enrich the current sample of this kind of systems. For KIC 10686876 only preliminary results have been published regarding its dominant pulsational frequencies (Liakos & Niarchos 2017). Therefore, KIC 10686876 together with KIC 04851217 were selected for detailed analyses for first time. The selected sample of binaries comprises the ∼2.7% of the 73 currently known detached binaries with a δ Scuti component (Liakos & Niarchos 2017, and subsequent individual publications as given in Table 6) and the ∼4.9% of those with Porb < 13 days. Moreover, the present sample increases the sample of such systems observed by Kepler (i.e. with detailed asteroseismic modeling) by ∼10.5%.
The results from the personal ground-based spectroscopic observations, which allowed the estimation of the spectral types of the primary components of both studied systems, are given in Sect. 3. Section 4 includes the combined analysis of the Kepler LCs and the spectroscopic data, which results in accurate modelings and estimations of the absolute parameters of the components of these systems. Further analyses of the LCs residuals, using Fourier transformation techniques, and the pulsational characteristics of the δ Scuti stars are presented in Sect. 5. The evolutionary status and the properties of the pulsating components of these systems are discussed and compared with other similar ones in Sect. 6. The discussion, summary, and conclusions are presented in Sect. 7.
2. History of the selected systems
2.1. KIC 04851217
This system (HD 225524) has a period of ∼2.47 d and a slightly eccentric orbit. Its first reference can be found in the Henry Draper extension catalogue (Cannon 1936). Its first LC was obtained by Hartman et al. (2004) during the HATNET Variability Survey, while it was also observed by the ASAS survey (Pigulski et al. 2009). Armstrong et al. (2014) estimated the temperature of the system at 7022 K, while spectra obtained by LAMOST survey classified it between A5IV-A9V spectral types (Gray et al. 2016; Frasca et al. 2016; Qian et al. 2018). Gies et al. (2015) calculated through an ETV analysis that the orbital period of the system increases with a rate ∼1.71 × 10⁻⁶ yr−1. The RVs for both components have been obtained by Matson et al. (2017, K1 = 115 km s−1, K2 = 107 km s−1) and Hełminiak et al. (2019, K1 = 131 km s−1, and K2 = 115 km s−1). In the latter work, the masses of the components were calculated based also on the Kepler LCs.
2.2. KIC 10686876
KIC 10686876 (TYC 3562-961-1) has an orbital period of ∼2.62 d. Its first LC was obtained by the Trans-atlantic Exoplanet Survey (TrES; Devor et al. 2008), while its temperature has been determined in the range 7944−8167 K (Slawson et al. 2011; Christiansen et al. 2012; Huber et al. 2014). Gies et al. (2015), Zasche et al. (2015), and Borkovits et al. (2016) performed ETV analysis of the system and found a long-term cyclic modulation of its Porb, which was attributed to the existence of a tertiary component. Zasche et al. (2015) determined the period of the third body as ∼6.7 yr and its mass function as f(m3) = 0.021 M⊙. In the same study, a preliminary LC modeling was also performed assuming a mass ratio of 1, resulting in a third light contribution of ∼5%. Davenport (2016) listed it among the Kepler systems exhibiting flare activity. Liakos & Niarchos (2017) included the system in their catalogue, mentioning also the dominant frequency of its δ Scuti component (21.02 d−1). Matson et al. (2017) performed spectroscopic observations and measured the RVs of the primary component (K1 = 67 km s−1).
3. Ground-based spectroscopy
The spectroscopic observations aimed at deriving the spectral types of the primary components of the selected systems. The spectra of the KIC targets were obtained with the 2.3 m Ritchey-Cretien Aristarchos telescope at the Helmos Observatory in Greece in August and October 2016. The Aristarchos Transient Spectrometer3 (ATS) instrument (Boumis et al. 2004), using the low resolution grating (600 lines mm−1), was employed for the observations. This set-up provided a resolution of ∼3.2 Å pixel−1 and a spectral coverage at a range of approximately 4000−7260 Å. The spectral classification is based on a spectral line correlation technique between the spectra of the variables and standard stars, which were observed with the same set-up. Table 2 includes the: name of the system (KIC), dates of observations, exposure time used (ET), and the orbital phase of the system when the spectrum was obtained (Φorb). All spectra were calibrated (bias, dark, flat-field corrections) using the MAXIm DL software. The data reduction (wavelength calibration, cosmic rays removal, spectra normalisation, sky background removal) was made with the RAVERE v.2.2c software (Nelson 2009).
Spectroscopic observations log and results for the primary components of the studied systems.
The correlation method was presented in detail in Liakos (2017), but is described here also in brief. The Balmer and the strong metallic lines between 4000 and 6800 Å were used for the comparison between the spectra of the KIC systems and the standards. The differences of spectral line depths between each standard star and the variables derive sums of squared residuals in each case, with the least squares sums to indicate the best fit. This method works very well in cases of binaries with large luminosity difference between the components, where the primary star dominates the total spectrum. However, in order to check possible contribution of the secondaries to the observed spectra, which would lead to an underestimation of the temperatures of the primary stars, another method was applied. Specifically, using the standard stars spectra, all possible combinations (i.e. combined spectra; sum of spectra) between spectral types A, F, G, and K were calculated. Moreover, for each spectra combination, the individual spectra were given weights, that are related to the light contribution of the components. The starting value for the contribution of the primary component was 0.5 and the step was 0.05. For each spectra combination, ten sub-combinations with different light contributions of the components were calculated. Each combined spectrum was compared with those of the variables deriving sums of squared residuals. Similarly to the direct comparison method, the least squares sums lead to the best match.
The light contribution of the primary of KIC 10686876 was found to be more than 95%, hence, its spectrum was compared directly with those of the standard stars. The components of KIC 04851217 were found to contribute almost equally to the observed spectrum, and, moreover, to be of the same spectral type. Therefore, practically, the combined spectrum was the same with that of a single star. The sum of squared residuals against the spectral type for these systems is plotted in Fig. 2. The best fit for the spectrum of KIC 04851217 was found with that of an A6V standard star and that of KIC 10686876 with an A5V standard star. The spectra of both systems, along with those of best-fit standard stars, are given in Fig. 3. Table 2 includes also the spectral classification of the primary component of each system and the corresponding temperature values (Teff) according to the relations between effective temperatures and spectral types of Cox (2000). A formal error of one sub-class is adopted and is propagated also in the temperature determination. The present results are shown to be in very good agreement with those of previous studies within the error ranges (see Sects. 2.1 and 2.2).
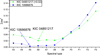 |
Fig. 2. Spectral type-search plots for KIC 04851217 and KIC 10686876. The points of KIC 04851217 are shifted vertically for better viewing. The arrows show the adopted spectral type for the primary component of each system. The comparison is shown only between A3-F3 spectral types due to scaling. |
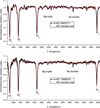 |
Fig. 3. Comparison spectra of the studied systems (black lines) and standard stars (red lines) with the closest spectral types. The Balmer and some strong metallic lines are also indicated. |
4. Light-curve modelling and absolute parameters calculation
The selected systems were observed during multiple quarters of the Kepler mission in long-cadence mode. Additionally, both of them were also observed in short-cadence mode during two or more quarters. Given that the primary objective of this work is the asteroseismic analysis of the pulsating stars of these systems (i.e. derivation of their oscillation frequencies and mode identification), only the short-cadence data (downloaded from the KEBC; Prša et al. 2011) were used for the subsequent analyses. The log of observations is given in Table 3, which includes: the level of light contamination (light contam.), the total points, the number of days that are covered by the data, and the number of the fully covered LCs. For both systems, the total covering time of observations is more than 1.8 years, which can be considered quite sufficient for the study of short-period pulsations (i.e. order of hours) and more than enough for LC modelling. The short-cadence Kepler data of approximately 40 days of observations for each system are plotted in Fig. 4. The phases and the flux to magnitude conversions of both systems were calculated using the ephemerides (T0, Porb) and the Kp magnitudes, respectively, as given in KEBC (Prša et al. 2011, see also Table 4).
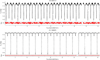 |
Fig. 4. Short-cadence LCs (black points) for the studied systems and their residuals (red points) after the subtraction of the LC models. The plotted data concern only 40 days of observations, while the rest are not shown due to scaling. |
Log of short-cadence observations from the Kepler mission for the studied systems.
The LCs analyses were made with the PHOEBE v.0.29d software (Prša & Zwitter 2005) that is based on the 2003 version of the Wilson-Devinney code (Wilson & Devinney 1971; Wilson 1979, 1990). Temperatures of the primaries were assigned values derived from the present spectral classification (see Sect. 3 and Table 2) and were kept fixed during the analysis, while the temperatures of the secondaries T2 were adjusted. Initially, for both systems, the albedos, A1 and A2, and gravity darkening coefficients, g1 and g2, were given values according to the spectral types of the components (Ruciński 1969; von Zeipel 1924; Lucy 1967). The (linear) limb darkening coefficients, x1 and x2, were taken from the tables of van Hamme (1993). The synchronicity parameters, F1 and F2, were initially left free, but since they did not show any significant change during the iterations, they were given a value of 1 (tidal locking). The dimensionless potentials, Ω1 and Ω2, the fractional luminosity of the primary component, L1, and the inclination of the system, i, were set as adjustable parameters. The third light contribution, l3, was also set as adjustable parameter for the system which either exhibits significant light contamination or there is information about possible tertiary component. For the present sample of systems, l3 was taken into account only for KIC 10686876 (see Sect. 4.2 for details), while for KIC 04851217, the light contamination is negligible (< 0.3%). At this point, it should be noted that since the CCD sensors of Kepler have effective wavelength response between approximately 410−910 nm, with a peak at ∼588 nm, the R filter (Bessell photometric system–range between 550−870 nm and with a transmittance peak at 597 nm) was selected as the best representative for the filter-dependent parameters (i.e. x and L).
As described in previous works (Liakos 2017, 2018), the analyses of EBs observed by Kepler LCs require some special attention due to light variations between successive LCs. Therefore, in order to avoid a super simplified model that includes all data points folded into the Porb, the method based on one model per LC (using normal points) or one model per a group of successive LCs folded into the Porb was followed. The reasons for this are: (a) the brightness changes from cycle to cycle due to magnetic activity and (b) the asymmetries due to the pulsations (i.e. superimpositions or damping of the various frequency modes). It should be noted that the derived LC residuals should exclude as much as possible the proximity and other stellar effects (e.g. magnetic activity) in order to subsequently perform an accurate frequency analysis (see Sect. 5). The “one model per LC or per a group of successive LCs” technique also provides the means of deriving more realistic errors for the adjusted parameters and minimise the widely known “unrealistic” error estimation of PHOEBE. The final LC model of a system includes the average values of the respective parameters from all the individual models, while their errors are the standard deviations of these. The LC analyses were applied in modes 2 (detached system), 4 (semi-detached system with the primary component filling its Roche lobe), and 5 (conventional semi-detached binary). Neither of these systems could converge in any semi-detached mode, therefore, both of them can be plausibly considered as detached EBs. The method described above is general and additional information for the analysis of each system is given in the following subsections.
4.1. KIC 04851217
For this system, there are two spectroscopic studies regarding the RVs of its components in the literature. As mentioned in Sect. 2.1, Matson et al. (2017) calculated the amplitudes of the RVs as K1 = 115 km s−1 and K2 = 107 km s−1 for the primary and the secondary components, respectively, while Hełminiak et al. (2019) found K1 = 131 km s−1 and K2 = 115 km s−1. In the latter study, the authors, in addition to their personal observations, also used data from the Trans-atlantic Exoplanet Survey (TrES; Alonso et al. 2004) and Apache Point Observatory Galactic Evolution Experiment (APOGEE; Majewski et al. 2017). Therefore, that work is considered as more complete and reliable, given the larger data set used, hence, their results were adopted for the present study. According to these K1 and K2 values, a mass ratio (q) of 1.14 ± 0.04 was calculated. This value was initially assigned in PHOEBE, but during the iterations, it was left free to adjust inside its error range. Moreover, due to the displacement of the secondary minimum from the phase 0.5, the eccentricity, e, and the argument of periastron, ω, were also left free to adjust. Given that no brightness changes due to magnetic activity were detected, one model per approximately six successive LCs folded into the Porb was derived, resulting in total in 27 individual LC models.
4.2. KIC 10686876
The analysis of this system was revealed as the most complicated in comparison with the one above. First, using the findings of Matson et al. (2017), who measured the RV1 and calculated K1 = 67 ± 2 km s−1, and according to the present results about the spectral type of the primary component (A5V), the analysis was constrained in the range of 0.4 < q < 0.5 (cf. Wang et al. 2019). In this regime, the expected mass of the primary ranges between 1.5−2.5 M⊙. However, following exactly the same method as for the other studied EB (i.e. the same fixed parameters and the spots assumption to fit the asymmetries), no sufficient solution could be achieved within this q range. Therefore, the iterations continued beyond this range and the best solution was found for q ∼ 0.28. The LC solution for this q value derives M1 = 6 M⊙, M2 = 1.72 M⊙, and T2 ∼ 4800 K. Although this was the best numerical solution based on the sum of squared residuals, however, there was no physical meaning regarding the parameters of the components. Therefore, the modelling started again in the q range between 0.4−0.5, with the difference that A2 was set to 1, which can be interpreted as reflection from the much hotter primary component. KIC 10686876 presents significant brightness changes due to magnetic activity (listed also as system exhibiting flare activity by Davenport 2016), hence, hot and cool spots on the surface of the secondary component were adopted. In addition, l3 was also adjusted because the system (a) has a light contamination of 1.7% (Table 3) and (b) possibly hosts a tertiary component (Gies et al. 2015; Zasche et al. 2015; Borkovits et al. 2016).
The LC modeling results for both systems are given in the upper and middle panels of Table 4. Examples of LC modeling and the Roche geometry of each system are illustrated in Fig. 5. The LCs residuals after the subtraction of the individual models are shown below the observed LCs in Fig. 4. In addition, the parameters of the spots for each LC (cycle) of KIC 10686876 (Table A.1) are given in Appendix A. The variations of the parameters of the spots over time and various 2D representations showing the positions of the spots on the surface of the secondary component for two different dates of observations are plotted in Fig. A.1.
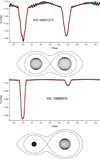 |
Fig. 5. Theoretical (solid lines) over observed (points) LCs (one cycle) and two-dimensional representations of the Roche geometry at orbital phase 0.75 for the studied systems. |
Modelling and absolute parameters for the studied systems.
Using the RVs curves for these systems, the absolute parameters of their components can be fairly formed. However, given that for KIC 10686876 only the RV1 has been measured, the mass of its primary was inferred from its spectral type according to the spectral type-mass correlations of Cox (2000) for main-sequence stars. A fair mass error value of 10% was also adopted. The secondary’s mass follows from the determined mass ratio. The semi-major axes a, which fix the absolute mean radii, can then be derived from Kepler’s third law. The luminosities (L), the gravity acceleration (log g), and the bolometric magnitudes values (Mbol) were calculated using the standard definitions. The absolute parameters were calculated with the software ABSPAREB (Liakos 2015) and they are given in the lower panel of Table 4.
5. Pulsation frequency analysis
The results from spectroscopy and LC modelling (Sects. 3 and 4) indicate that for KIC 10686876, it is only the primary component that fits well to the profiles of the δ Scuti type stars (i.e. mass and temperature). On the other hand, the components of KIC 04851217 show similar physical properties, therefore, an additional search was needed in order to reveal the pulsating component (see Sect. 5.1). The pulsation frequency analysis was performed with the software PERIOD04 v.1.2 (Lenz & Breger 2005), which is based on classical Fourier analysis. The typical frequencies range of δ Scuti stars is 4−80 d−1 (Breger 2000; Bowman & Kurtz 2018), hence, the search should have been made for this range. However, an extensive range between 0−80 d−1 was selected for the search since δ Scuti stars in binary systems may also present g-mode pulsations that are connected to their Porb or present hybrid behaviour of γ Doradus- δ Scuti type. For these analyses, the LCs residuals of each system (i.e. after the subtraction of the LCs models) were used (Fig. 4). A 4σ limit was adopted (i.e. S/N = 4; recommended by Lenz & Breger 2005) for the reliability of the detected frequencies. Hence, after the first frequency computation the residuals were subsequently pre-whitened for the next one until the detected frequency had S/N ∼ 4. The Nyquist frequency and the frequency resolution according to the Rayleigh-Criterion (i.e. 1/T, where T is the observations time range in days) are 733 d−1 and 0.0007 d−1 for KIC 04851217, and 732 d−1 and 0.001 d−1 for KIC 10686876, respectively.
After the search for frequencies, the relation of Breger (2000) was used for the calculation of the pulsation constants (Q) of the independent frequencies:
 (1)
(1)
where f is the frequency of the pulsation mode, while log g, Mbol, and Teff denote the standard quantities (see Sect. 4). Subsequently, using the pulsation constant – density relation,
 (2)
(2)
where fdom is the frequency of the dominant pulsation mode (i.e. that with the largest amplitude), the density of the pulsator ρpul in solar units was also calculated. The results for the aforementioned quantities for each pulsator are given in Table 5. It should be noted that the Q values for all modes of both pulsators, except one for KIC 10686876, lie within the typical range of δ Scuti stars (i.e. 0.015 < Q < 0.035; Breger 2000). Moreover, it should also be noted that the majority of δ Scuti stars exhibit intrinsic amplitude modulation (Bowman et al. 2016; Barceló Forteza et al. 2020), hence, fdom may differ from time to time. Therefore, the calculated densities presented here might be not that accurate. However, they can be considered as representatives since the respective calculations for the other pulsation modes for both systems yield very similar values.
Independent oscillation frequencies and mode identification for the pulsating components of both systems.
The mode identification (i.e. l-degrees and the type of each oscillation) was made using the theoretical MAD models for δ Scuti stars (Montalbán & Dupret 2007) in the FAMIAS software v.1.01 (Zima 2008). These models have a grid step of 0.05−0.1 M⊙ in the mass range of 1.6−2.2 M⊙, which is sufficient for the studied systems. The models (l-degrees) of the detected independent frequencies that corresponded to the parameters (log g, M, and Teff) of the pulsators were adopted as the most probable oscillation modes. Moreover, Ppul/Porb ratios for all frequencies were also calculated and found below 0.07, except for f7 of KIC 10686876, indicating that they are probably of p-mode type (Zhang et al. 2013).
The results for the independent frequencies for both systems as well as their mode identification are given also in Table 5. The frequency values fi with the respective amplitudes A, phases Φ, and S/N are listed along with the Q, ρpul, Ppul/Porb, l-degrees, and modes. Similarly, the parameters of the dependent (combination) frequencies are given in Tables B.1 and B.2. The periodograms of the systems, where the independent frequencies and the stronger frequencies that are connected to their Porb are indicated, as well as the distributions of the frequencies, are given in Fig. 6. Examples of the Fourier fitting on the observed points for both systems are given in Fig. 7. Comments and information for the individual analysis of each system are given in the following subsections.
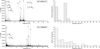 |
Fig. 6. Periodograms (left panels) and frequencies distributions (right panels) for the studied systems. The independent frequencies and the strong frequencies that are connected to the Porb are also indicated. |
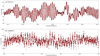 |
Fig. 7. Fourier fitting (solid lines) samples on various data points for both systems. |
5.1. KIC 04851217
The results of the LC modelling (Sect. 4) for this system show that its components are very similar regarding their absolute properties (i.e. mass, temperature, log g; see Table 4). Therefore, it is not any easy task to understand directly which of the components is the pulsating member since the physical characteristics of both of them are well inside the range of those of δ Scuti stars. Moreover, the system does not exhibit any total eclipses that would help to see when the pulsations are completely vanish. Therefore, as an approximation, the data during the eclipses were used to check the behaviour of the stronger frequencies. In particular, the data points between the orbital phases 0.97−0.03 (primary eclipse) and 0.45−0.514 (secondary eclipse) were used for two different frequency analyses. The periodograms for each data set are plotted together for direct comparison in Fig. 8. The results show that during the primary eclipse, the amplitudes of the frequencies are almost tripled in comparison with the respective ones during the secondary eclipse. During the primary eclipse, the hotter component is occulted, hence, the emitted light comes mainly from the secondary component. Therefore, according to these findings, the most likely oscillating component is the secondary one (i.e. the more massive and slightly cooler component).
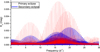 |
Fig. 8. Periodograms for the data during the eclipses (red = primary; blue = secondary) of KIC 04851217. The amplitudes of the frequencies during the primary eclipse are almost tripled, indicating that the pulsating member of the system is the secondary component. |
Four independent frequencies in the regime 15.7−19.1 d−1 and another 86 combination frequencies were found. The frequencies are spread throughout the regions 0.01−6.1 d−1 (39) and 15.2−20.3 (41). Two main concentrations of frequencies are distinguished, one between 15−17.5 d−1 and another between 18−20.5 d−1. Frequencies less than 6.1 d−1 are either combinations of others or are multiples of the orbital frequency forb (e.g. f5, f8). According to the theoretical models, the f1 or the f14 might be the radial fundamental mode, while the rest frequencies are non-radial pressure modes.
5.2. KIC 10686876
The pulsating star of this system oscillates in five independent frequencies and in 102 more (depended). All the independent frequencies, except for f7, were detected between 19.8−23.1 d−1. The f7 has a value ∼0.18 d−1 and no relevance with any other frequency or combination was found. From the total 107 detected frequencies, 38 of them have values less than 5 d−1, 59 are uniformly spread in the range 5−35 d−1, while ten more lie between 35−68.5 d−1. The theoretical models showed that all independent frequencies, except for f7, are non-radial p-modes.
The distribution of the frequencies plausibly arises the scenario about possible δ Scuti-γ Doradus hybrid behaviour. According to the criteria of Uytterhoeven et al. (2011), an hybrid star of this type has to (a) present frequencies in both regimes, (b) the amplitudes in the two domains must be either comparable or the amplitudes should not differ by more than a factor of 5−7, and (c) at least two independent frequencies should be detected in both regions with amplitudes higher than 100 ppm. In the case of KIC 10686876, f7 is the only independent frequency in the γ Doradus domain and its amplitude is lower by a factor of ∼4.4 in comparison with that of f1. Therefore, although the criteria (a) and (b) are satisfied, the (c) is not. Hence, this pulsating star is not likely an hybrid. However, given the large amount of adjusted parameters in the LC modelling (see Sect. 4.2), this frequency may be an artifact. It should be noticed that forb ∼ 2.1f7. All the other low frequencies can be derived from the combinations of the independent ones or are connected to the forb (i.e. integer multiples). Another possibility for the origin of f7 is that it is a g-mode oscillation caused by the gravity influence of the secondary component.
6. Evolution, comparison with similar systems, and correlations
This section includes the evolutionary status of the studied systems within the mass-radius (M-R) and Hertzsprung-Russell (HR) diagrams and a comparison of their properties with other similar systems. For the latter comparison, the parameters of the pulsating stars and their host systems, as given in Liakos & Niarchos (2017, Tables 1 and 2 therein), were used. However, since almost three years have been passed from that publication, new cases of such systems were collected from the literature in order to enlarge the sample. Updated parameters for seven already known cases, 14 new ones, and the systems of the present study are listed in Table 6. This table includes also for each system: The name, the orbital period (Porb), and the type of variability (ToV), while, particularly, for the δ Scuti components are given: The dominant pulsation frequency (fdom), the mass (Mpul), the radius (Rpul), the temperature (Tpul), and the gravity acceleration value (log gpul).
New cases of detached EBs with a δ Scuti component and known systems with updated properties of their pulsators after the publication of the catalogue of Liakos & Niarchos (2017).
The positions of the components of the studied systems along with the δ Scuti stars of other detached binaries within the M-R and HR diagrams are given in Figs. 9 and 10, respectively. All the components are located on the main-sequence. The primaries of both systems and the secondary of KIC 04851217 follow very well the theoretical evolutionary tracks of Girardi et al. (2000) (see Fig. 10) according to their derived masses and the corresponding error ranges (see Table 4). Therefore, it seems that they have been evolving without any significant interactions so far. The secondary of KIC 10686876, on the other hand, although it was found to lie inside the main-sequence in both evolutionary diagrams, it does not follow very well the evolutionary tracks for M = 0.9 M⊙. It appears closer to zero age main-sequence (ZAMS) in the M-R diagram and closer to the terminal age main-sequence (TAMS) in the HR diagram. However, the errors on its mass, radius, temperature, and luminosity values are large enough to accept this discrepancy as a possible under- (or over-) estimation of some of its parameters rather than speculating on possible mass transfer from the present primary to the secondary. From evolutionary point of view, the δ Scuti stars of the studied systems are well inside the absolute properties ranges of δ Scuti stars in detached binaries and inside the classical instability strip.
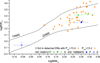 |
Fig. 9. Location of the primary (filled symbols) and secondary (empty symbols) components of KIC 04851217 (triangles) and KIC 10686876 (squares) within the mass-radius diagram. The stars and the “x” symbols denote the δ Scuti components of other detached systems with Porb shorter and longer than 13 d, respectively (taken from Liakos & Niarchos 2017, and Table 6), while the black solid lines represent the boundaries of main-sequence. |
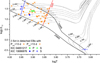 |
Fig. 10. Location of the components of both studied systems within the HR diagram. Symbols and black solid lines have the same meaning as in Fig. 9. Dotted lines denote the evolutionary tracks for stars with masses between 0.6−0.9 M⊙ and 1.5−2.4 M⊙ (taken from Girardi et al. 2000) and the colored solid lines (B = Blue, R = Red) the boundaries of the instability strip (IS; taken from Soydugan et al. 2006b). |
The pulsating components of the systems under study were placed among others of similar properties (i.e. δ Scuti stars of other detached binaries) in the orbital-pulsational periods diagram (Ppul − Porb), which is shown in Fig. 11. The sample of systems with Porb < 13 d (41 in total) for this plot was gathered from the catalogue of Liakos & Niarchos (2017) and Table 6. A new linear fit between these quantities was made and resulted in the following relation:
 (3)
(3)
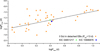 |
Fig. 11. Locations of the pulsating components of the studied systems among other δ Scuti stars-members of detached systems with Porb < 13 d within the Porb − Ppul diagram. Symbols have the same meaning as in Fig. 9, while the solid line denotes the present linear fit. |
where r is the correlation coefficient. The difference of this relation with that of Liakos & Niarchos (2017) is negligible with both the slope and the intercept values to vary inside their error ranges. That means that, although the present sample is 58% larger than that of Liakos & Niarchos (2017), the deviation between the fittings is very small, hence, the Ppul − Porb correlation can be considered as well established. It should to be noted that both systems under study follow very well the empirical curve (solid line in Fig. 11).
The correlation between the quantities log g − log Ppul is shown in Fig. 12. However, as a next step to the respective correlation of Liakos & Niarchos (2017), it has been found useful to present correlations for two samples based on their Porb values. For this, similarly to the Ppul − Porb correlation, the sample of δ Scuti stars in detached binaries, for which log g and Ppul values are known, was gathered from the same catalogue and table as before. The whole sample was divided into two subgroups, with the first to contain 33 δ Scuti stars in detached systems with Porb < 13 d and the second, 18 cases in systems with longer Porb values. Linear fits on the data points of each group were attempted and produced the following correlations:
 (4)
(4)
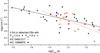 |
Fig. 12. Locations of the pulsating components of the studied systems within the log g − Ppul diagram. Symbols have the same meaning as in Fig. 9. Solid and dashed lines denote the present empirical correlations for δ Scuti components in detached binary systems with Porb < 13 d and Porb > 13 d, respectively. |
for systems with Porb < 13 d and
 (5)
(5)
for systems with Porb > 13 d.
The differences between these two correlations are not negligible. Both the slope and the intercept values have large deviations from each other, indicating that the proximity plays significant role to the pulsations. In particular, the δ Scuti stars in systems with Porb < 13 d have longer Ppul values for a given log g. That means that as the star evolves, the frequency values decrease with a slower rate when the star is in a system with Porb < 13 d rather than if it was in a system with longer Porb. According to the stellar evolution, as a pulsating star evolves through the classical instability strip, its oscillating frequencies values decrease. However, the distribution of the δ Scuti stars in detached binaries and their corresponding correlations (Fig. 12) show that the proximity of the companion star is very crucial to the braking of the pulsational frequencies. Therefore, it can be concluded that the close binarity not only initiates the pulsations sooner (i.e. the majority of δ Scuti stars in binaries are mostly MS stars; Liakos & Niarchos 2017), but also preserves them for a longer period of time.
7. Summary, discussion, and conclusions
In this paper, detailed LCs and frequency analyses for two Kepler detached EBs are presented. The present study extends the current sample of this kind of systems (i.e. δ Scuti stars in detached binary systems with Porb < 13 d) by ∼5%. Ground-based spectroscopic observations of these systems allowed to estimate the spectral types of their primaries with an error of one sub-class. Moreover, literature RVs were also used for their modelling. The absolute parameters of the components of both systems as well as their evolutionary stages were also estimated. The pulsational characteristics of their oscillating members were determined and were found to lie well inside the range of properties of the δ Scuti stars. For both systems, only a very small fraction of the detected pulsation frequencies (i.e. less than 4.7%) were identified as independent. This comes in good agreement with the results of Kurtz et al. (2015b) for pulsating stars of different types. Furthermore, a comparison of their absolute properties with theoretical stellar evolutionary models was made, while the oscillation modes of their independent frequencies were also estimated using theoretical models of δ Scuti stars.
KIC 04851217 was found to have a slightly eccentric orbit and to contain very similar components in terms of absolute parameters. The components were found to be of A6 spectral class. Both members are on the main sequence and, so far, there is no sign of any strong interaction (e.g. mass transfer). Due to their similarity, a frequency analysis for the data during the eclipses was needed to assess which one is the pulsator. The results showed that the secondary component is more likely to be the δ Scuti member and it pulsates in four independent frequencies (with the dominant one at ∼19.09 d−1) and in another 86 combination frequencies. Two of the independent frequencies were identified as possible radial modes, while the rest as non-radial pressure modes.
KIC 10686876 was revealed as a most difficult case for analysis, although its K1 was calculated by Matson et al. (2017). The difficulties in analysis concerned the selection of the adjusted parameters since it was listed as a possible flare system (Davenport 2016) and it is candidate for hosting a tertiary component (Gies et al. 2015; Zasche et al. 2015; Borkovits et al. 2016). The spectrum of the system indicated that the primary component is of A5 spectral class. Both components were found to lie within the MS. For a better LC fitting, a cool spot and a hot spot on the surface of the secondary were assumed for the majority of the LCs.
The LCs modeling of KIC 10686876 revealed a third light contribution of 2.9% in slight contrast with the value of 5% determined by Zasche et al. (2015). However, the present results for the hypothesis of a tertiary component can be considered more accurate since the value of Zasche et al. (2015) was based on the assumption of q = 1. From the present LC solution, and by taking into account the level of light contamination of 1.7% in the system’s field of view, it can be roughly estimated that the clear third light contribution is ∼1.2%. In order to estimate the minimum mass of the potential tertiary component, the findings of Zasche et al. (2015) regarding the mass function, f(m3) = 0.0207 M⊙, of the third body, the absolute parameters of the components of the EB (M1 = 2 M⊙ and M2 = 0.88 M⊙; Table 4), and the following formula (Mayer 1990) were used:
 (6)
(6)
where M are the masses of the components and i3 the inclination of the tertiary body’s orbit. For i3 = 90° (i.e. coplanar orbits of the EB and the third body), the minimum mass of the additional component (M3, min) yields a value of 0.6 M⊙. Following the formalism of Liakos et al. (2011), Liakos & Niarchos (2013), that is, assuming that this component is a main-sequence star and by using the INPEVEB software (Liakos 2015), the luminosity contribution of the tertiary member to the total light is found to be ∼1.1%. This value comes in very well agreement with the observed one (L3/LTotal ∼ 1.2%). Therefore, we may concluded that the most possible scenario is that another main-sequence component with mass slightly greater than 0.6 M⊙ in coplanar orbit or with a mass of 0.6 M⊙ and slightly non-coplanar orbit revolves around the EB with a period of ∼6.72 yr (Zasche et al. 2015) and a semi-major axis of 4.4 AU. Another possible explanation for the cyclic modulation of the system’s Porb could be the magnetic braking mechanism (Applegate 1992). According to the criteria of Lanza & Rodonò (2002) regarding the quadrupole moment variation ΔQ and by using the INPEVEB software (Liakos 2015), it was found that the secondary component has a value of ΔQ = 1.77 × 1051 g cm2, which is outside the range set by criteria. Therefore, the third body existence is the most probable orbital period modulator mechanism of this EB.
The primary component of KIC 10686876 was found to oscillate in five independent frequencies, with the dominant one at 21.02 d−1. The theoretical models showed that all frequencies are likely p-modes. The independent f7 ∼ 0.18 d−1 and the majority of the remaining 102 combination frequencies, which were detected in the range of 0−5 d−1, enabled the scenario assuming possible δ Scuti-γ Doradus hybrid behaviour. However, using the criteria of Uytterhoeven et al. (2011), it can be concluded that the star is probably not an hybrid, whereas, due to the complexity of its LC model and the large number of free parameters, the reliability of f7 might be questioned.
The comparison of the locations of the pulsating stars of the studied systems with those of other similar ones in the log Porb − log Ppul and log g − log Ppul diagrams showed that they neatly follow both the trend of the other data points as well as the empirical fitting curves. Moreover, a sample division of the δ Scuti stars in detached systems in those with Porb < 13 d and in those with longer Porb values showed that the evolution of the frequencies depends on the proximity of the companion star. In particular, the empirical fittings on these two subgroups showed that the pulsations frequencies of the δ Scuti stars in detached binaries with Porb < 13 d decrease with a slower rate than those that belong in systems with wider orbits.
Using the relation between of luminosity and Ppul for δ Scuti stars of Ziaali et al. (2019):
 (7)
(7)
the distance of each system can be calculated using the distance modulus:
 (8)
(8)
where mV and MV are the apparent and absolute magnitudes, respectively. Using the dominant Ppul values given in Table 5, it is feasible to calculate the MV (Eq. (7)); thus, using the catalogued mV (The Tycho-2 catalogue; Høg et al. 2000), the distance of each system can be derived from Eq. (8). Results for both systems are given in Table 7.
Magnitudes and distances of the systems.
Regarding any future studies on KIC 10686876, it may be mentioned that RV measurements of its secondary will either confirm or modify the absolute parameter values. However, the acquisition of RV2 can be considered extremely difficult since its primary dominates the spectra with a factor of more than 94%. In general, detailed LCs and pulsation analyses of other Kepler or TESS detached systems with pulsating components is highly recommended since the sample of these systems is still small, but at the same time, it holds a great deal of promise for expanding our knowledge of pulsations in binary systems.
Notice that the orbit of the system is slightly eccentric and the secondary minimum occurs at Φorb ∼ 0.48.
Acknowledgments
The author acknowledges financial support by the European Space Agency (ESA) under the Near Earth object Lunar Impacts and Optical TrAnsients (NELIOTA) programme, contract no. 4000112943. The author wishes to thank Mrs Maria Pizga for proofreading the text and the anonymous referee for the valuable comments. The “Aristarchos” telescope is operated on Helmos Observatory by the Institute for Astronomy, Astrophysics, Space Applications and Remote Sensing of the National Observatory of Athens. This research has made use of NASA’s Astrophysics Data System Bibliographic Services, the SIMBAD, the Mikulski Archive for Space Telescopes (MAST), and the Kepler Eclipsing Binary Catalog data bases.
References
- Aerts, C., Christensen-Dalsgaard, J., & Kurtz, D. W. 2010, Asteroseismology (Netherlands: Springer) [Google Scholar]
- Alonso, R., Brown, T. M., Torres, G., et al. 2004, ApJ, 613, L153 [NASA ADS] [CrossRef] [Google Scholar]
- Antoci, V., Cunha, M., Houdek, G., et al. 2014, ApJ, 796, 118 [NASA ADS] [CrossRef] [Google Scholar]
- Antoci, V., Cunha, M. S., Bowman, D. M., et al. 2019, MNRAS, 490, 4040 [NASA ADS] [CrossRef] [Google Scholar]
- Applegate, J. H. 1992, ApJ, 385, 621 [NASA ADS] [CrossRef] [Google Scholar]
- Armstrong, D. J., Gómez Maqueo Chew, Y., Faedi, F., & Pollacco, D. 2014, MNRAS, 437, 3473 [NASA ADS] [CrossRef] [Google Scholar]
- Balona, L. A., Daszyńska-Daszkiewicz, J., & Pamyatnykh, A. A. 2015, MNRAS, 452, 3073 [NASA ADS] [CrossRef] [Google Scholar]
- Barceló Forteza, S., Moya, A., Barrado, D., et al. 2020, A&A, 638, A59 [CrossRef] [EDP Sciences] [Google Scholar]
- Borkovits, T., Hajdu, T., Sztakovics, J., et al. 2016, MNRAS, 455, 4136 [NASA ADS] [CrossRef] [Google Scholar]
- Borucki, W. J., Koch, D., Basri, G., et al. 2010, Science, 327, 977 [NASA ADS] [CrossRef] [PubMed] [Google Scholar]
- Boumis, P., Meaburn, J., & Goudis, C. D. 2004, in Hellenic Astronomical Society Sixth Astronomical Conference, ed. P. Laskarides, 313 [Google Scholar]
- Bowman, D. M., & Kurtz, D. W. 2018, MNRAS, 476, 3169 [NASA ADS] [CrossRef] [Google Scholar]
- Bowman, D. M., Kurtz, D. W., Breger, M., Murphy, S. J., & Holdsworth, D. L. 2016, MNRAS, 460, 1970 [NASA ADS] [CrossRef] [Google Scholar]
- Bowman, D. M., Johnston, C., Tkachenko, A., et al. 2019, ApJ, 883, L26 [NASA ADS] [CrossRef] [Google Scholar]
- Breger, M. 2000, in Delta Scuti and Related Stars, eds. M. Breger, & M. Montgomery, ASP Conf. Ser., 210, 3 [Google Scholar]
- Cannon, A. J. 1936, Annal. Harvard Coll. Obs., 100, 1 [Google Scholar]
- Catanzaro, G., Ripepi, V., Bernabei, S., et al. 2011, MNRAS, 411, 1167 [NASA ADS] [CrossRef] [Google Scholar]
- Chen, X., Zhang, X., Li, Y., et al. 2020, ApJ, 895, 136 [CrossRef] [Google Scholar]
- Christiansen, J. L., Jenkins, J. M., Caldwell, D. A., et al. 2012, PASP, 124, 1279 [NASA ADS] [CrossRef] [Google Scholar]
- Cox, A. N. 2000, Allen’s Astrophysical Quantities (New York: Springer-Verlag) [Google Scholar]
- Davenport, J. R. A. 2016, ApJ, 829, 23 [Google Scholar]
- Derekas, A., Murphy, S. J., Dálya, G., et al. 2019, MNRAS, 486, 2129 [CrossRef] [Google Scholar]
- Devor, J., Charbonneau, D., O’Donovan, F. T., Mandushev, G., & Torres, G. 2008, AJ, 135, 850 [NASA ADS] [CrossRef] [Google Scholar]
- Dimitrov, D., Kraicheva, Z., & Popov, V. 2008, Inf. Bull. Var. Stars, 5842, 1 [Google Scholar]
- Eker, Z., Bilir, S., Soydugan, F., et al. 2014, PASA, 31, e024 [NASA ADS] [CrossRef] [Google Scholar]
- Faigler, S., Kull, I., Mazeh, T., et al. 2015, ApJ, 815, 26 [NASA ADS] [CrossRef] [Google Scholar]
- Frasca, A., Molenda-Żakowicz, J., De Cat, P., et al. 2016, A&A, 594, A39 [NASA ADS] [CrossRef] [EDP Sciences] [Google Scholar]
- Gaia Collaboration (Prusti, T., et al.) 2016, A&A, 595, A1 [NASA ADS] [CrossRef] [EDP Sciences] [Google Scholar]
- Garcés, L. J., Mennickent, R. E., & Zharikov, S. 2017, PASP, 129, 044203 [CrossRef] [Google Scholar]
- Gaulme, P., & Guzik, J. A. 2014, in Precision Asteroseismology, eds. J. A. Guzik, W. J. Chaplin, G. Handler, & A. Pigulski, IAU Symp., 301, 413 [Google Scholar]
- Gaulme, P., & Guzik, J. A. 2019, A&A, 630, A106 [CrossRef] [EDP Sciences] [Google Scholar]
- Gies, D. R., Matson, R. A., Guo, Z., et al. 2015, AJ, 150, 178 [NASA ADS] [CrossRef] [Google Scholar]
- Girardi, L., Bressan, A., Bertelli, G., & Chiosi, C. 2000, A&AS, 141, 371 [NASA ADS] [CrossRef] [EDP Sciences] [Google Scholar]
- Grassitelli, L., Fossati, L., Langer, N., et al. 2015, A&A, 584, L2 [NASA ADS] [CrossRef] [EDP Sciences] [Google Scholar]
- Gray, R. O., Corbally, C. J., De Cat, P., et al. 2016, AJ, 151, 13 [NASA ADS] [CrossRef] [Google Scholar]
- Guo, Z., Gies, D. R., Matson, R. A., & García Hernández, A. 2016, ApJ, 826, 69 [NASA ADS] [CrossRef] [Google Scholar]
- Guo, Z., Gies, D. R., Matson, R. A., et al. 2017a, ApJ, 837, 114 [NASA ADS] [CrossRef] [Google Scholar]
- Guo, Z., Gies, D. R., & Matson, R. A. 2017b, ApJ, 851, 39 [NASA ADS] [CrossRef] [Google Scholar]
- Guo, Z., Fuller, J., Shporer, A., et al. 2019, ApJ, 885, 46 [NASA ADS] [CrossRef] [Google Scholar]
- Hambleton, K. M., Kurtz, D. W., Prša, A., et al. 2013, MNRAS, 434, 925 [NASA ADS] [CrossRef] [MathSciNet] [Google Scholar]
- Hartman, J. D., Bakos, G., Stanek, K. Z., & Noyes, R. W. 2004, AJ, 128, 1761 [NASA ADS] [CrossRef] [Google Scholar]
- Hełminiak, K. G., Ukita, N., Kambe, E., et al. 2017, A&A, 602, A30 [NASA ADS] [CrossRef] [EDP Sciences] [Google Scholar]
- Hełminiak, K. G., Konacki, M., Maehara, H., et al. 2019, MNRAS, 484, 451 [CrossRef] [Google Scholar]
- Høg, E., Fabricius, C., Makarov, V. V., et al. 2000, A&A, 355, L27 [Google Scholar]
- Howell, S. B., Sobeck, C., Haas, M., et al. 2014, PASP, 126, 398 [NASA ADS] [CrossRef] [Google Scholar]
- Huber, D., Silva Aguirre, V., Matthews, J. M., et al. 2014, ApJS, 211, 2 [NASA ADS] [CrossRef] [Google Scholar]
- Jayasinghe, T., Stanek, K. Z., Kochanek, C. S., et al. 2020, MNRAS, 493, 4186 [CrossRef] [Google Scholar]
- Kahraman Aliçavuş, F., Soydugan, E., Smalley, B., & Kubát, J. 2017, MNRAS, 470, 915 [NASA ADS] [CrossRef] [Google Scholar]
- Koch, D. G., Borucki, W. J., Basri, G., et al. 2010, ApJ, 713, L79 [NASA ADS] [CrossRef] [Google Scholar]
- Kurtz, D. W., Hambleton, K. M., Shibahashi, H., Murphy, S. J., & Prša, A. 2015a, MNRAS, 446, 1223 [NASA ADS] [CrossRef] [Google Scholar]
- Kurtz, D. W., Shibahashi, H., Murphy, S. J., Bedding, T. R., & Bowman, D. M. 2015b, MNRAS, 450, 3015 [NASA ADS] [CrossRef] [Google Scholar]
- Kurtz, D. W., Handler, G., Rappaport, S. A., et al. 2020, MNRAS, 494, 5118 [CrossRef] [Google Scholar]
- Lampens, P., Frémat, Y., Vermeylen, L., et al. 2018, A&A, 610, A17 [CrossRef] [EDP Sciences] [Google Scholar]
- Lanza, A. F., & Rodonò, M. 2002, Astron. Nachr., 323, 424 [NASA ADS] [CrossRef] [Google Scholar]
- Lee, J. W., Hong, K., Kim, S.-L., & Koo, J.-R. 2016a, MNRAS, 460, 4220 [NASA ADS] [CrossRef] [Google Scholar]
- Lee, J.-W., Kim, S.-L., Hong, K., et al. 2016b, AJ, 151, 25 [NASA ADS] [CrossRef] [Google Scholar]
- Lee, J. W., Hong, K., Kim, S.-L., & Koo, J.-R. 2017, ApJ, 835, 189 [NASA ADS] [CrossRef] [Google Scholar]
- Lee, J. W., Hong, K., Koo, J.-R., & Park, J.-H. 2018, AJ, 155, 5 [NASA ADS] [CrossRef] [Google Scholar]
- Lee, J. W., Hong, K., & Kristiansen, M. H. 2019a, AJ, 157, 17 [CrossRef] [Google Scholar]
- Lee, J. W., Kristiansen, M. H., & Hong, K. 2019b, AJ, 157, 223 [CrossRef] [Google Scholar]
- Lee, J. W., Hong, K., & Kristiansen, M. H. 2020, PASJ, 72, 37 [CrossRef] [Google Scholar]
- Lehmann, H., Southworth, J., Tkachenko, A., & Pavlovski, K. 2013, A&A, 557, A79 [NASA ADS] [CrossRef] [EDP Sciences] [Google Scholar]
- Lenz, P., & Breger, M. 2005, Commun. Asteroseismol., 146, 53 [NASA ADS] [CrossRef] [Google Scholar]
- Liakos, A. 2015, in Living Together: Planets, Host Stars and Binaries, eds. S. M. Rucinski, G. Torres, & M. Zejda, ASP Conf. Ser., 496, 286 [Google Scholar]
- Liakos, A. 2017, A&A, 607, A85 [NASA ADS] [CrossRef] [EDP Sciences] [Google Scholar]
- Liakos, A. 2018, A&A, 616, A130 [NASA ADS] [CrossRef] [EDP Sciences] [Google Scholar]
- Liakos, A., & Cagaš, P. 2014, Ap&SS, 353, 559 [CrossRef] [Google Scholar]
- Liakos, A., & Niarchos, P. 2009, Commun. Asteroseismol., 160, 2 [Google Scholar]
- Liakos, A., & Niarchos, P. 2013, Ap&SS, 343, 123 [CrossRef] [Google Scholar]
- Liakos, A., & Niarchos, P. 2015, in Living Together: Planets, Host Stars and Binaries, eds. S. M. Rucinski, G. Torres, & M. Zejda, ASP Conf. Ser., 496, 195 [Google Scholar]
- Liakos, A., & Niarchos, P. 2016, Proceedings of the 12th Hellenic Astronomical Conference, held 28 June – 2 July, 2015 in Thessaloniki, Greece [Google Scholar]
- Liakos, A., & Niarchos, P. 2017, MNRAS, 465, 1181 [NASA ADS] [CrossRef] [Google Scholar]
- Liakos, A., Zasche, P., & Niarchos, P. 2011, New Astron., 16, 530 [NASA ADS] [CrossRef] [Google Scholar]
- Liakos, A., Niarchos, P., Soydugan, E., & Zasche, P. 2012, MNRAS, 422, 1250 [NASA ADS] [CrossRef] [Google Scholar]
- Lucy, L. B. 1967, ZAp, 65, 89 [NASA ADS] [Google Scholar]
- Maceroni, C., Lehmann, H., Da Silva, R., et al. 2014, A&A, 563, A59 [NASA ADS] [CrossRef] [EDP Sciences] [Google Scholar]
- Majewski, S. R., Schiavon, R. P., Frinchaboy, P. M., et al. 2017, AJ, 154, 94 [NASA ADS] [CrossRef] [Google Scholar]
- Matson, R. A., Gies, D. R., Guo, Z., & Williams, S. J. 2017, AJ, 154, 216 [NASA ADS] [CrossRef] [Google Scholar]
- Maxted, P. F. L., Serenelli, A. M., Marsh, T. R., et al. 2014, MNRAS, 444, 208 [NASA ADS] [CrossRef] [Google Scholar]
- Mayer, P. 1990, Bull. Astron. Inst. Czechoslov., 41, 231 [Google Scholar]
- Mkrtichian, D. E. 2019, Inf. Bull. Var. Stars, 6259, 1 [Google Scholar]
- Mkrtichian, D. E., Kusakin, A. V., Gamarova, A. Y., & Nazarenko, V. 2002, in IAU Colloq. 185: Radial and Nonradial Pulsationsn as Probes of Stellar Physics, eds. C. Aerts, T. R. Bedding, & J. Christensen-Dalsgaard, ASP Conf. Ser., 259, 96 [Google Scholar]
- Mkrtichian, D. E., Lehmann, H., Rodríguez, E., et al. 2018, MNRAS, 475, 4745 [NASA ADS] [CrossRef] [Google Scholar]
- Montalbán, J., & Dupret, M. A. 2007, A&A, 470, 991 [NASA ADS] [CrossRef] [EDP Sciences] [Google Scholar]
- Murphy, S. J. 2018, https://doi.org/10.5281/zenodo.2533474 [Google Scholar]
- Murphy, S. J., & Shibahashi, H. 2015, MNRAS, 450, 4475 [NASA ADS] [CrossRef] [Google Scholar]
- Murphy, S. J., Pigulski, A., Kurtz, D. W., et al. 2013, MNRAS, 432, 2284 [NASA ADS] [CrossRef] [Google Scholar]
- Murphy, S. J., Hey, D., Van Reeth, T., & Bedding, T. R. 2019, MNRAS, 485, 2380 [NASA ADS] [CrossRef] [Google Scholar]
- Nelson, B. 2009, RaVeRe (Radial Velocity Reductions) [Google Scholar]
- Ou, J.-W., Yang, M., & Zhou, J.-L. 2019, Res. Astron. Astrophys., 19, 112 [CrossRef] [Google Scholar]
- Pigulski, A., Pojmański, G., Pilecki, B., & Szczygieł, D. M. 2009, Acta Astron., 59, 33 [NASA ADS] [Google Scholar]
- Prša, A., & Zwitter, T. 2005, ApJ, 628, 426 [NASA ADS] [CrossRef] [Google Scholar]
- Prša, A., Batalha, N., Slawson, R. W., et al. 2011, AJ, 141, 83 [NASA ADS] [CrossRef] [Google Scholar]
- Qian, S. B., Li, L. J., He, J. J., et al. 2018, MNRAS, 475, 478 [CrossRef] [Google Scholar]
- Ricker, G. R., Latham, D. W., Vanderspek, R. K., et al. 2009, Am. Astron. Soc. Meet. Abstr., 213, 403.01 [Google Scholar]
- Ricker, G. R., Winn, J. N., Vanderspek, R., et al. 2015, J. Astron. Telesc. Instrum. Syst., 1, 014003 [NASA ADS] [CrossRef] [Google Scholar]
- Ruciński, S. M. 1969, Acta Astron., 19, 245 [Google Scholar]
- Samadi Ghadim, A., Lampens, P., & Jassur, M. 2018, MNRAS, 474, 5549 [CrossRef] [Google Scholar]
- Sandquist, E. L., Stello, D., Arentoft, T., et al. 2020, AJ, 159, 96 [CrossRef] [Google Scholar]
- Schmid, V. S., & Aerts, C. 2016, A&A, 592, A116 [NASA ADS] [CrossRef] [EDP Sciences] [Google Scholar]
- Shappee, B., Prieto, J., Stanek, K. Z., et al. 2014, Am. Astron. Soc. Meet. Abstr., 223, 236.03 [Google Scholar]
- Skarka, M., Kabáth, P., Paunzen, E., et al. 2019, MNRAS, 487, 4230 [CrossRef] [Google Scholar]
- Slawson, R. W., Prša, A., Welsh, W. F., et al. 2011, AJ, 142, 160 [NASA ADS] [CrossRef] [Google Scholar]
- Southworth, J., Zima, W., Aerts, C., et al. 2011, MNRAS, 414, 2413 [NASA ADS] [CrossRef] [Google Scholar]
- Sowicka, P., Handler, G., Dębski, B., et al. 2017, MNRAS, 467, 4663 [NASA ADS] [CrossRef] [Google Scholar]
- Soydugan, E., İbanoğlu, C., Soydugan, F., Akan, M. C., & Demircan, O. 2006a, MNRAS, 366, 1289 [NASA ADS] [CrossRef] [Google Scholar]
- Soydugan, E., Soydugan, F., Demircan, O., & İbanoğlu, C. 2006b, MNRAS, 370, 2013 [NASA ADS] [CrossRef] [Google Scholar]
- Tkachenko, A., Lehmann, H., & Mkrtichian, D. E. 2009, A&A, 504, 991 [NASA ADS] [CrossRef] [EDP Sciences] [Google Scholar]
- Turner, G., & Holaday, J. 2015, J. Am. Assoc. Var. Star Obs. (JAAVSO), 43, 40 [NASA ADS] [Google Scholar]
- Uytterhoeven, K., Moya, A., Grigahcène, A., et al. 2011, A&A, 534, A125 [NASA ADS] [CrossRef] [EDP Sciences] [Google Scholar]
- van Hamme, W. 1993, AJ, 106, 2096 [NASA ADS] [CrossRef] [Google Scholar]
- von Zeipel, H. 1924, MNRAS, 84, 665 [NASA ADS] [CrossRef] [Google Scholar]
- Wang, K., Luo, C., Zhang, X., et al. 2018, AJ, 156, 187 [CrossRef] [Google Scholar]
- Wang, K., Zhang, X., Luo, Y., & Luo, C. 2019, MNRAS, 486, 2462 [CrossRef] [Google Scholar]
- Wilson, R. E. 1979, ApJ, 234, 1054 [NASA ADS] [CrossRef] [Google Scholar]
- Wilson, R. E. 1990, ApJ, 356, 613 [NASA ADS] [CrossRef] [Google Scholar]
- Wilson, R. E., & Devinney, E. J. 1971, ApJ, 166, 605 [NASA ADS] [CrossRef] [Google Scholar]
- Yang, Y., Yuan, H., Dai, H., & Zhang, X. 2018, PASJ, 70, 24 [CrossRef] [Google Scholar]
- Yang, T. Z., Liu, J., & Zuo, Z. 2019, ApJ, submitted [arXiv:1912.04167] [Google Scholar]
- Zasche, P., Wolf, M., Kučáková, H., et al. 2015, AJ, 149, 197 [NASA ADS] [CrossRef] [Google Scholar]
- Zhang, X.-B., Luo, C.-Q., & Fu, J.-N. 2013, ApJ, 777, 77 [NASA ADS] [CrossRef] [Google Scholar]
- Zhang, X.-B., Deng, L. C., Tian, J.-F., et al. 2014, AJ, 148, 106 [CrossRef] [Google Scholar]
- Zhang, X. B., Fu, J. N., Liu, N., Luo, C. Q., & Ren, A. B. 2017, ApJ, 850, 125 [NASA ADS] [CrossRef] [Google Scholar]
- Zhang, X. B., Wang, K., Chen, X. H., Luo, C. Q., & Zhang, C. G. 2019, ApJ, 884, 165 [CrossRef] [Google Scholar]
- Ziaali, E., Bedding, T. R., Murphy, S. J., Van Reeth, T., & Hey, D. R. 2019, MNRAS, 486, 4348 [NASA ADS] [CrossRef] [Google Scholar]
- Zima, W. 2008, Commun. Asteroseismol., 157, 387 [NASA ADS] [Google Scholar]
Appendix A: Spot migration
This appendix includes information for the spots migration in time for KIC 10686876 that was found to present magnetic activity. Details can be found in Sect. 4. As corresponding timings in Table A.1 are taken the average BJD values of the points included in the models from which the respective parameters (latitude Co-lat, longitude Co-long, radius, and temperature factor Tf) were calculated. The upper and middle parts of Fig. A.1 show the changes of the parameters of all spots over time for each quarter of observations, while the lower part shows the spots on the secondary’s surface during different days of observations.
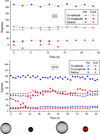 |
Fig. A.1. Top panels: spot migration diagram for KIC 10686876 during Q3 (upper panel) and Q10 (middle panel). Lower left panel: positions of both spots on the surface of the secondary at orbital phase 0.15 during the first day of Q10, lower right panel: positions of both spots on the same component at an orbital phase of 0.12 during the 91st day of Q10. |
Spot parameters for KIC 10686876 for the quarters 3 and 10 of Kepler mission.
Appendix B: Lists of combined frequencies
Tables B.1 and B.2 contain the values of the depended frequencies fi (where i is an increasing number), semi-amplitudes A, phases Φ, and S/N. Moreover, in the last column of these tables, the most possible combination for each frequency is also given.
Combination frequencies of KIC 04851217.
Combination frequencies of KIC 10686876.
All Tables
Known cases of binaries with a δ Scuti component observed by the Kepler and K2 missions categorised according to their Roche geometry.
Spectroscopic observations log and results for the primary components of the studied systems.
Log of short-cadence observations from the Kepler mission for the studied systems.
Independent oscillation frequencies and mode identification for the pulsating components of both systems.
New cases of detached EBs with a δ Scuti component and known systems with updated properties of their pulsators after the publication of the catalogue of Liakos & Niarchos (2017).
All Figures
|
Fig. 1. Demographics of the published cases of binaries with a δ Scuti component observed by the Kepler and K2 missions according to their Roche geometry and type of variability. |
| In the text | |
|
Fig. 2. Spectral type-search plots for KIC 04851217 and KIC 10686876. The points of KIC 04851217 are shifted vertically for better viewing. The arrows show the adopted spectral type for the primary component of each system. The comparison is shown only between A3-F3 spectral types due to scaling. |
| In the text | |
|
Fig. 3. Comparison spectra of the studied systems (black lines) and standard stars (red lines) with the closest spectral types. The Balmer and some strong metallic lines are also indicated. |
| In the text | |
|
Fig. 4. Short-cadence LCs (black points) for the studied systems and their residuals (red points) after the subtraction of the LC models. The plotted data concern only 40 days of observations, while the rest are not shown due to scaling. |
| In the text | |
|
Fig. 5. Theoretical (solid lines) over observed (points) LCs (one cycle) and two-dimensional representations of the Roche geometry at orbital phase 0.75 for the studied systems. |
| In the text | |
|
Fig. 6. Periodograms (left panels) and frequencies distributions (right panels) for the studied systems. The independent frequencies and the strong frequencies that are connected to the Porb are also indicated. |
| In the text | |
|
Fig. 7. Fourier fitting (solid lines) samples on various data points for both systems. |
| In the text | |
|
Fig. 8. Periodograms for the data during the eclipses (red = primary; blue = secondary) of KIC 04851217. The amplitudes of the frequencies during the primary eclipse are almost tripled, indicating that the pulsating member of the system is the secondary component. |
| In the text | |
|
Fig. 9. Location of the primary (filled symbols) and secondary (empty symbols) components of KIC 04851217 (triangles) and KIC 10686876 (squares) within the mass-radius diagram. The stars and the “x” symbols denote the δ Scuti components of other detached systems with Porb shorter and longer than 13 d, respectively (taken from Liakos & Niarchos 2017, and Table 6), while the black solid lines represent the boundaries of main-sequence. |
| In the text | |
|
Fig. 10. Location of the components of both studied systems within the HR diagram. Symbols and black solid lines have the same meaning as in Fig. 9. Dotted lines denote the evolutionary tracks for stars with masses between 0.6−0.9 M⊙ and 1.5−2.4 M⊙ (taken from Girardi et al. 2000) and the colored solid lines (B = Blue, R = Red) the boundaries of the instability strip (IS; taken from Soydugan et al. 2006b). |
| In the text | |
|
Fig. 11. Locations of the pulsating components of the studied systems among other δ Scuti stars-members of detached systems with Porb < 13 d within the Porb − Ppul diagram. Symbols have the same meaning as in Fig. 9, while the solid line denotes the present linear fit. |
| In the text | |
|
Fig. 12. Locations of the pulsating components of the studied systems within the log g − Ppul diagram. Symbols have the same meaning as in Fig. 9. Solid and dashed lines denote the present empirical correlations for δ Scuti components in detached binary systems with Porb < 13 d and Porb > 13 d, respectively. |
| In the text | |
|
Fig. A.1. Top panels: spot migration diagram for KIC 10686876 during Q3 (upper panel) and Q10 (middle panel). Lower left panel: positions of both spots on the surface of the secondary at orbital phase 0.15 during the first day of Q10, lower right panel: positions of both spots on the same component at an orbital phase of 0.12 during the 91st day of Q10. |
| In the text | |
Current usage metrics show cumulative count of Article Views (full-text article views including HTML views, PDF and ePub downloads, according to the available data) and Abstracts Views on Vision4Press platform.
Data correspond to usage on the plateform after 2015. The current usage metrics is available 48-96 hours after online publication and is updated daily on week days.
Initial download of the metrics may take a while.