Free Access
Fig. 4.
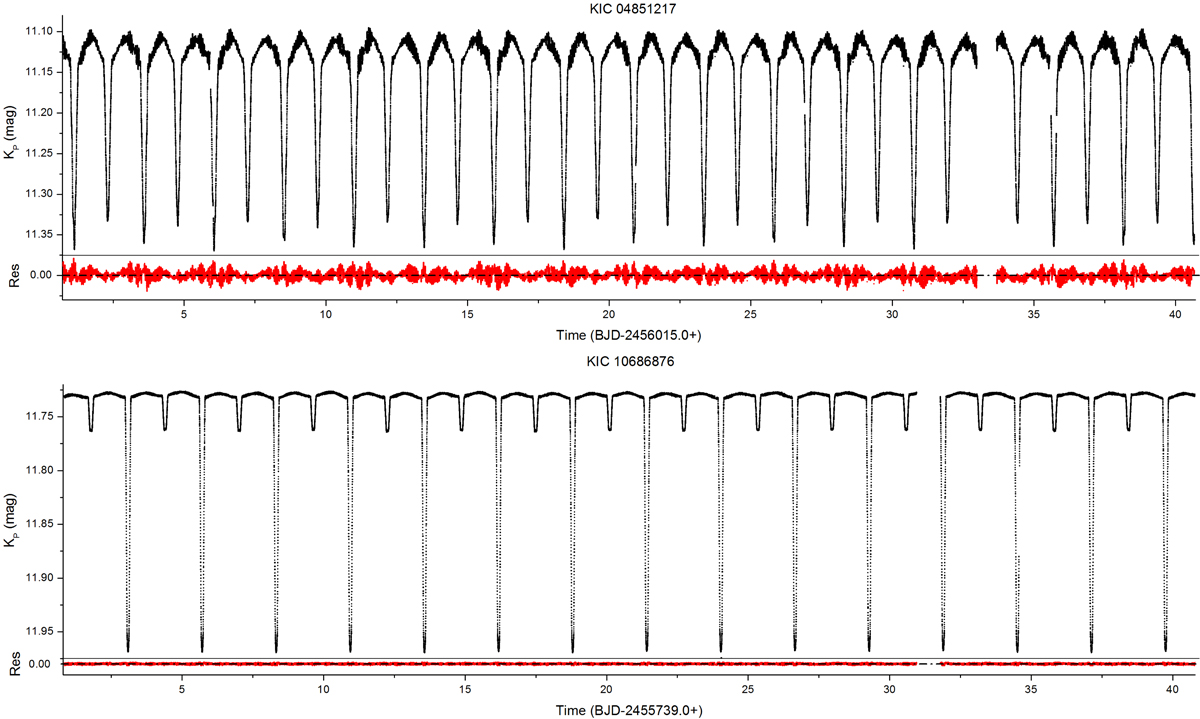
Short-cadence LCs (black points) for the studied systems and their residuals (red points) after the subtraction of the LC models. The plotted data concern only 40 days of observations, while the rest are not shown due to scaling.
Current usage metrics show cumulative count of Article Views (full-text article views including HTML views, PDF and ePub downloads, according to the available data) and Abstracts Views on Vision4Press platform.
Data correspond to usage on the plateform after 2015. The current usage metrics is available 48-96 hours after online publication and is updated daily on week days.
Initial download of the metrics may take a while.