Fig. A.1.
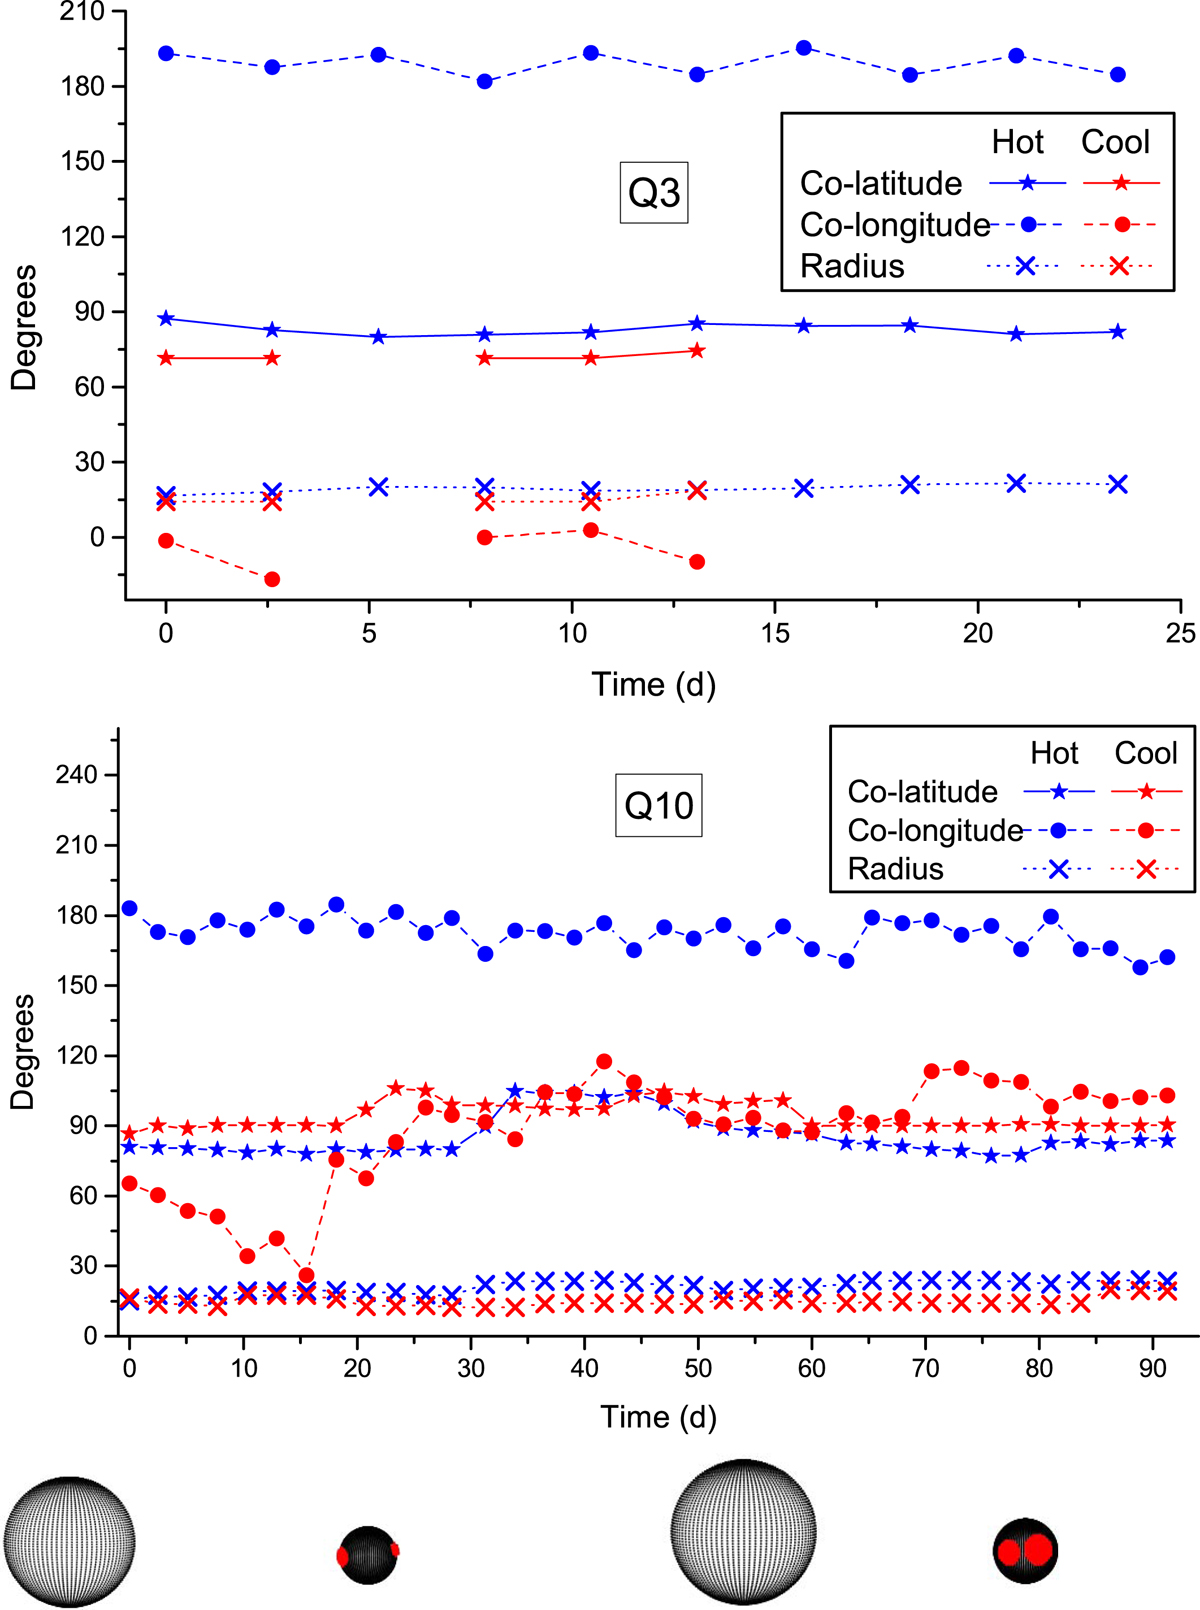
Top panels: spot migration diagram for KIC 10686876 during Q3 (upper panel) and Q10 (middle panel). Lower left panel: positions of both spots on the surface of the secondary at orbital phase 0.15 during the first day of Q10, lower right panel: positions of both spots on the same component at an orbital phase of 0.12 during the 91st day of Q10.
Current usage metrics show cumulative count of Article Views (full-text article views including HTML views, PDF and ePub downloads, according to the available data) and Abstracts Views on Vision4Press platform.
Data correspond to usage on the plateform after 2015. The current usage metrics is available 48-96 hours after online publication and is updated daily on week days.
Initial download of the metrics may take a while.