| Issue |
A&A
Volume 641, September 2020
|
|
|---|---|---|
| Article Number | A119 | |
| Number of page(s) | 9 | |
| Section | Extragalactic astronomy | |
| DOI | https://doi.org/10.1051/0004-6361/202038470 | |
| Published online | 18 September 2020 | |
Nonparametric galaxy morphology from UV to submm wavelengths
1
Sterrenkundig Observatorium, Universiteit Gent, Krijgslaan 281 S9, 9000 Gent, Belgium
e-mail: This email address is being protected from spambots. You need JavaScript enabled to view it.
2
National Observatory of Athens, Institute for Astronomy, Astrophysics, Space Applications and Remote Sensing, Ioannou Metaxa and Vasileos Pavlou, 15236 Athens, Greece
3
INAF – Istituto di Radioastronomia, Via P. Gobetti 101, 40129 Bologna, Italy
4
INAF – Osservatorio Astrofisico di Arcetri, Largo E. Fermi 5, 50125 Firenze, Italy
5
INAF – Istituto di Astrofisica Spaziale e Fisica cosmica, Via A. Corti 12, 20133 Milano, Italy
6
Space Telescope Science Institute, 3700 San Martin Drive, Baltimore, MD 21218, USA
7
Department of Physics and Astronomy, University College London, Gower Street, London WC1E 6BT, UK
8
Instituto de Radioastronomía y Astrofísica, UNAM, Antigua Carretera a Pátzcuaro # 8701, Ex-Hda. San José de la Huerta, 58089 Morelia, Michoacán, Mexico
9
AIM, CEA, CNRS, Université Paris-Saclay, Université Paris Diderot, Sorbonne Paris Cité, 91191 Gif-sur-Yvette, France
10
Central Astronomical Observatory of RAS, Pulkovskoye Chaussee 65/1, 196140 St. Petersburg, Russia
11
St. Petersburg State University, Universitetskij Pr. 28, 198504 St. Petersburg, Stary Peterhof, Russia
12
Centre for Astrophysics Research, University of Hertfordshire, College Lane, Hatfield AL10 9AB, UK
Received:
22
May
2020
Accepted:
3
July
2020
Abstract
We present the first nonparametric morphological analysis of a set of spiral galaxies from UV to submillimeter (submm) wavelengths. Our study is based on high-quality multi-wavelength imaging for nine well-resolved spiral galaxies from the DustPedia database, combined with nonparametric morphology indicators calculated in a consistent way using the StatMorph package. We measure the half-light radius, the concentration index, the asymmetry index, the smoothness index, the Gini coefficient, and the M20 indicator in various wavebands from UV to submm wavelengths, and in stellar mass, dust mass, and star formation rate maps. We find that the interstellar dust in galaxies is distributed in a more extended, less centrally concentrated, more asymmetric, and more clumpy way than the stars are. This is particularly evident when comparing morphological indicators based on the stellar mass and dust mass maps. This should serve as a warning sign against treating the dust in galaxies as a simple smooth component. We argue that the nonparametric galaxy morphology of galaxies from UV to submm wavelengths is an interesting test for cosmological hydrodynamics simulations.
Key words: galaxies: structure / galaxies: spiral
© ESO 2020
1. Introduction
The morphology of galaxies is essential to understand how galaxies form and evolve. Galaxy morphology is the basis of the standard classification schemes (Sandage 2005) and correlates with a wide range of physical properties, such as optical color, stellar mass, star formation history, and local environment (Dressler 1980; Conselice 2003; Bundy et al. 2005; Skibba et al. 2009; Bluck et al. 2014). In the current era of massive large-area surveys, an objective and automated determination of galaxy morphology is required.
While novel approaches are being proposed on a regular basis (e.g., Huertas-Company et al. 2015; Dieleman et al. 2015; Beck et al. 2018; Martin et al. 2020; Cheng et al. 2020; Uzeirbegovic et al. 2020), the most popular way to quantify galaxy morphology is to make use of morphological features or indicators. These indicators are often the parameters of analytical models fitted to the surface brightness distribution of galaxies, such as effective radii and Sérsic parameters derived from single-component Sérsic model fits (Bruce et al. 2012; van der Wel et al. 2012; Kennedy et al. 2015) or bulge-to-disk ratios from multi-component image decompositions (MacArthur et al. 2003; Gadotti 2009; Lange et al. 2016; Méndez-Abreu et al. 2017; Gao et al. 2018; Kruk et al. 2018; Bottrell et al. 2019).
An alternative method consists of the use of nonparametric morphological indicators, which are indicators that do not assume a fixed functional form of the surface brightness distribution. The most popular sets of nonparametric indicators are the concentration–asymmetry–smoothness (CAS) indices (Abraham & Merrifield 2000; Bershady et al. 2000; Conselice 2003) and the Gini–M20 indices (Abraham et al. 2003; Lotz et al. 2004). Both sets have been widely applied to optical and near-IR (NIR) images of large samples of galaxies (Lotz et al. 2006; Scarlata et al. 2007; Conselice et al. 2009; Huertas-Company et al. 2009; Holwerda et al. 2014; Conselice 2014; Rodriguez-Gomez et al. 2019). One interesting aspect of nonparametric morphological indicators is that they can easily be applied to any image, and not only those dominated by stellar emission. As such, they are ideal tools to objectively and quantitatively compare the morphology of different galaxy components (Bendo et al. 2007; Muñoz-Mateos et al. 2009; Holwerda et al. 2011; Psychogyios et al. 2016).
No statistical nonparametric morphological studies have been made that extend into the far-infrared (FIR) and submillimeter (submm) regime. Muñoz-Mateos et al. (2009) do present measurements in the Spitzer MIPS 70 and 160 μm bands, but indicate that most of these values should be taken with caution. Thanks to the Herschel mission, these studies can be extended to the submm range where the emission of cold dust dominates. The angular resolution and sensitivity of Herschel are sufficient to spatially resolve large nearby galaxies, and several detailed studies of the cold dust emission within galaxies have been presented (e.g., Braine et al. 2010; Bendo et al. 2010, 2012; Aniano et al. 2012, 2020; Foyle et al. 2012; Mentuch Cooper et al. 2012; Smith et al. 2012; Hughes et al. 2014; Mosenkov et al. 2018, 2019).
In this paper we use multi-wavelength imaging from the DustPedia database1 (Davies et al. 2017; Clark et al. 2018) to present, for the first time, a nonparameteric morphological analysis of spiral galaxies from UV to submm wavelengths. Our goal is to consistently measure how galaxy morphology changes as a function of wavelength over this wide wavelength range. We also apply the same analysis to stellar mass, dust mass, and star formation rate (SFR) maps to directly quantify the morphology of different physical galaxy components. In Sect. 2 we discuss the sample and the data, in Sect. 3 we present the methodology we use for our analysis, in Sect. 4 we present our results, and in Section 5 we discuss the implications of our study.
2. Sample and data
For our analysis, we require an imaging data set of galaxies that satisfies the following conditions: (1) the galaxies should have high-quality imaging data available from UV to submm wavelengths, (2) the galaxies should be large enough on the sky to guarantee enough angular resolution out to 500 μm, and (3) the galaxies should not be too inclined to avoid strong projection effects.
The DustPedia project (Davies et al. 2017) was designed to gather a coherent multi-wavelength imaging data set for all nearby galaxies observed with Herschel and to analyze these data consistently with state-of-the-art modeling tools. Some salient results of the DustPedia project include an analysis of the dust heating mechanisms in galaxies (Nersesian et al. 2019, 2020; Verstocken et al. 2020; Viaene et al. 2020), determinations of dust absorption cross section within and between galaxies (Bianchi et al. 2019; Clark et al. 2019), and an investigation of the ISM scaling relations in different environments (Davies et al. 2019; Casasola et al. 2020).
The current project is based on the large face-on galaxy subsample considered by Casasola et al. (2017). They selected 18 galaxies from the DustPedia database with Herschel PACS and SPIRE imaging and with a submm diameter larger than 9 arcmin and axis ratio larger than 0.4. From this sample we selected the nine galaxies for which consistent imaging data were available over the entire UV–submm wavelength range with a smooth and sufficiently large background area in each band. Details on the galaxies considered are provided in Table 1. This sample, while small, contains galaxies with Hubble types ranging from T = 2 to T = 7, and covers 1.5 orders of magnitude in stellar mass, and more than an order of magnitude in dust mass and SFR.
Basic properties of the galaxies in our sample.
For all galaxies in our sample, we use the same imaging data as used by Casasola et al. (2017). We use images in the Galaxy Evolution Explorer (GALEX) far-UV (FUV) and near-UV (NUV) bands, the Sloan Digital Sky Survey (SDSS) g and i bands, the Spitzer IRAC 3.6 and 4.5 μm bands, the Wide-field Infrared Survey Explorer (WISE) 12 and 22 μm bands, the three Herschel PACS bands and the three Herschel SPIRE bands. For some galaxies, imaging data in the SDSS bands was not available, in which case we used the available B and R band images from the Spitzer Infrared Nearby Galaxy Survey (SINGS; Kennicutt et al. 2003) instead.
Foreground stars were removed from the GALEX, SDSS, and IRAC images based on the 2MASS All-Sky Catalog of Point Sources (Cutri et al. 2003). All images were background subtracted and corrected for Milky Way attenuation. For more details on the data reduction and processing, we refer to Casasola et al. (2017) and Clark et al. (2018).
The final step in our image processing consists of convolving all images to the SPIRE 500 μm PSF using the convolution kernels of Aniano et al. (2011) and re-gridding them on the same 12″ pixel scale. The goal of our paper is to investigate how the morphology of galaxies changes as a function of wavelength, at a fixed resolution. By convolving all images to the same PSF, we separate the intrinsic wavelength-dependent effects from potential additional effects due differences in angular resolution. Systematic effects on nonparametric morphological indicators due to changes in angular resolution have been studied in detail by various authors (e.g., Lotz et al. 2004; Bendo et al. 2007; Holwerda et al. 2011). These studies generally agree that the morphological parameters are not affected dramatically, as long as features smaller than about 1 kpc are resolved in the images. Our galaxies satisfy this criterion (see Table 1).
Apart from the monochromatic broadband images, we also considered stellar mass, dust mass, and SFR maps, which were generated as described in Casasola et al. (2017). In short, the stellar mass maps were created from the IRAC 3.6 and 4.5 μm images following the prescriptions from Querejeta et al. (2015). The method used to create these maps is based on the Independent Component Analysis method and disentangles the contribution of old stellar populations, PAH emission, and hot dust emission (Meidt et al. 2012). The dust mass maps were created by fitting THEMIS model dust SEDs (Jones et al. 2017) to each set of corresponding pixels in the PACS and SPIRE maps. Finally, SFR surface density maps were created combining GALEX FUV and WISE 22 μm maps according to the prescriptions of Bigiel et al. (2008) and Leroy et al. (2008).
Figures 1 and 2 show an overview of the GALEX FUV, IRAC 3.6 μm, WISE 22 μm, and SPIRE 350 μm images for all the galaxies in our sample. All images are convolved to the same FWHM and shown on a square root scale.
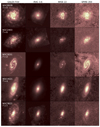 |
Fig. 1. GALEX FUV, IRAC 3.6 μm, WISE 22 μm, and SPIRE 350 μm images for NGC 0628 (M 74), NGC 2403, NGC 3031 (M 81), NGC 3521, and NGC 3621. All images are convolved to the same FWHM and are shown on a square root scale. |
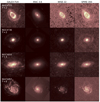 |
Fig. 2. GALEX FUV, IRAC 3.6 μm, WISE 22 μm, and SPIRE 350 μm images for NGC 4725, NGC 4736 (M 94), NGC 5055 (M 63), and NGC 5457 (M 101). All images are convolved to the same FWHM and are shown on a square root scale. |
3. Methodology
We measured nonparametric morphology indictors for all the maps in a consistent way using the StatMorph package2. This is a user-friendly Python implementation for the calculation of morphological statistics, described in detail by Rodriguez-Gomez et al. (2019). It is largely based on previous work by Lotz et al. (2004, 2006, 2008a,b) and has been thoroughly tested and applied in several independent studies (e.g., Calabrò et al. 2019; Bignone et al. 2020; Wu et al. 2020).
We applied StatMorph to the series of maps of each galaxy, with most of the settings fixed at the default values as recommended by Rodriguez-Gomez et al. (2019). For each galaxy, we created a segmentation map (Lotz et al. 2004) based on the FUV, IRAC 3.6 μm, and SPIRE 250 μm images and used it for the analysis of all images and maps of that galaxy.
In our analysis we concentrate on the following indices:
Half-light radius. The half-light radius Rhalf is calculated as the elliptical radius of the isophote that contains half of the emission. It is probably the most widely adopted indicator for the characteristic size of a galaxy.
Concentration. The concentration index is defined as 5log(R80/R20), where R20 and R80 are the elliptical radii of the isophotes that contain 20% and 80% of the light, respectively. The concentration of the light distribution in galaxies correlates reasonably well with Hubble type (Morgan 1958, 1959; Okamura et al. 1984; Bershady et al. 2000) and with several other physical properties such as bulge-to-disk ratio, Mg/Fe abundance ratio, and supermassive black hole mass (Graham et al. 2001; Conselice 2003; Vazdekis et al. 2004; Aswathy & Ravikumar 2018).
Asymmetry. The asymmetry index is obtained by subtracting the galaxy image rotated by 180° from the original image. This indicator can be used to search for indications of galaxy interactions and mergers, which often reveal strong asymmetry. For normal star-forming galaxies, the asymmetry parameter at optical wavelengths correlates with optical broadband color (Schade et al. 1995; Conselice et al. 2000; Conselice 2003).
Smoothness. The smoothness index, sometimes more appropriately called the clumpiness index, was originally introduced as a way to quantify the morphological dichotomy between early-type galaxies without significant ongoing star formation, and late-type galaxies dominated by it. It is obtained by subtracting a smoothed version of the galaxy image from the original image, so galaxies with a larger value for the smoothness index have a less smooth appearance. Smoothness indices based on optical images tend to correlate weakly with optical color and SFR (Conselice 2003).
Gini. The Gini coefficient was originally introduced in economics to measure wealth inequality (Gini 1912). In the context of galaxy morphology, it indicates the spread in intensity between the pixels in the aperture. It was introduced by Abraham et al. (2003) as a generalized measure of concentration that is applicable to galaxies of arbitrary shape.
M20 index. The M20 indicator measures the second moment of the brightest regions of a galaxy relative to the total second-order central moment. This indicator is also somewhat similar to the concentration index, but it is more sensitive to bright structures outside the center of the galaxy, and therefore relatively sensitive to spiral arms, rings, multiple nuclei, and tidal structures (Lotz et al. 2004; Holwerda et al. 2014). The Gini and M20 are often used together in order to separate galaxies in different subclasses (e.g., Lotz et al. 2008a; Rodriguez-Gomez et al. 2019).
The StatMorph package can also be used for Sérsic profile fitting and to calculate other nonparametric morphological indicators (Law et al. 2007; Freeman et al. 2013; Pawlik et al. 2016). The six commonly used indices discussed above are sufficient for our purposes.
4. Results
In Fig. 3 we show the six nonparametric morphology indicators as a function of wavelength, and for the stellar mass, dust mass, and SFR maps, for each of the nine galaxies in our sample. In Fig. 4 we show the same panel, but we focus on the global trends, which are represented by the black symbols with error bars, representing the mean and standard deviation within the sample.
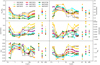 |
Fig. 3. Nonparametric morphological indicators for each of the galaxies in our sample as a function of wavelength, and for the stellar mass, dust mass, and SFR maps. The different panels correspond to the half-light radius Rhalf normalized by the optical R25 diameter (top left), the concentration index (top right), the asymmetry index (middle left), the smoothness index (middle right), the Gini coefficient (bottom left), and the M20 indicator (bottom right). |
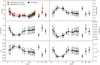 |
Fig. 4. Nonparametric morphological indicators for the galaxy sample as a whole as a function of wavelength, and for the stellar mass, dust mass, and SFR maps. The different panels are the same as in Fig. 3. The gray lines are the measurements for the individual galaxies in the sample, and the black symbols and their error bars correspond to the mean and the standard deviation of the different indicators over our galaxy sample. |
The half-light radius Rhalf, normalized to the optical R25 radius, has a characteristic behavior as a function of wavelength, with large values in the FUV and a gradual decrease over the optical regime to the NIR. In the FIR and submm, Rhalf increases systematically for all galaxies in our sample, and it reaches values at 500 μm similar to those in the FUV band. Not surprisingly, the Rhalf/R25 value for the stellar mass map is similar to the IRAC band values. Interestingly, the half-mass radius of the dust surface density map is larger than the half-light radius measured in any of the individual FIR or submm bands.
The dependence of galaxy size, defined in different ways, as a function of wavelength has been investigated by many authors, and our results are in qualitative agreement with these studies. The steady decline in the galaxy size from the UV to the NIR is due to a stellar mass-to-light ratio gradient, resulting from a combination of intrinsic stellar population gradients and stronger reddening by dust in the inner regions (de Jong 1996; MacArthur et al. 2003; Muñoz-Mateos et al. 2009, 2011). Conversely, the steady increase of Rhalf/R25 from mid-IR (MIR) to submm wavelengths is due to a dust temperature gradient, with colder dust residing at larger galactocentric radii (Hunt et al. 2015; Smith et al. 2016). The larger value of Rhalf from the dust mass map compared to the individual Herschel bands can be understood in the same way. The dust SED fits do indeed reveal a clear temperature gradient for the galaxies in our sample, as discussed by Casasola et al. (2017).
The red circles in the top left panel of Fig. 4 correspond to results by Casasola et al. (2017). These authors measured the scale-length h as a function of wavelength of their galaxies by fitting an exponential disk to the radial surface brightness profiles. We converted the scale-lengths for the galaxies in our sample to half-light radii using the relation Rhalf = 1.678 h appropriate for exponential disks. The agreement is excellent, except in the optical–NIR region, where Casasola et al. (2017) find larger values then we do here. The reason for this discrepancy is that they determine the scale-length of the disk only, whereas we determined Rhalf based on the entire light distribution. The presence of a substantial bulge contribution at optical–NIR wavelengths naturally leads to smaller values for Rhalf in our case. Similarly, the green symbols in the top left panel of Fig. 4 correspond to the mean effective radii for the galaxies in our sample as determined from Sérsic fits to the 2D surface brightness maps in five Herschel bands by Mosenkov et al. (2019). Again, the agreement is excellent, especially taking into account the different methods.
The concentration index shows a clear pattern when plotted as a function of wavelength for the galaxies in our sample: it generally increases from UV to NIR wavelengths, and subsequently drops back at MIR wavelengths (top right panel of Fig. 4). This behavior is in agreement with the results of Muñoz-Mateos et al. (2009). From the MIR to submm wavelengths, the concentration index is characterized by a relatively modest decrease, due to the decrease in dust temperature with increasing galactocentric radius. In general, the average values in the submm are similar to the FUV value. In agreement with these trends, we find a high concentration in the stellar mass map, and lower values in the dust mass and SFR maps.
The center-left panel of Fig. 4 shows a very consistent wavelength dependence for the asymmetry index: galaxies are highly asymmetric in the FUV, very symmetric in the NIR, and the asymmetry then keeps increasing towards submm wavelengths. This behavior at FUV–MIR wavelengths is in agreement with the results of Muñoz-Mateos et al. (2009). However, they find a decrease in the asymmetry towards the FIR for most galaxies, in disagreement with our continued increase until the last submm data point. This difference is most likely due to the poor resolution of their Spitzer MIPS data, whereas each galaxy in our limited sample is well resolved even in the SPIRE 500 μm band. We also note that the asymmetries measured from the dust mass maps are always higher than the asymmetries in each of the individual Herschel images.
On average, the smoothness index decreases sharply from UV to NIR wavelengths for the galaxies in our sample, implying that galaxies are more clumpy at shorter wavelengths. The smoothness index slightly increases from the NIR all the way to the submm. There is some diversity in our sample in the smoothness indices at FIR and submm wavelengths. Interestingly, the dust mass map has, again, a higher smoothness index than any of the individual Herschel maps.
A large spread in Gini indices at UV wavelengths is seen for the galaxies in our sample. On average, the Gini index increases with wavelength until the NIR, where the spread is largely reduced, and subsequently slowly decreases towards 500 μm. The dust mass maps have, on average, a lower Gini index than any broadband image. Our Gini indices are smaller than those measured by Bendo et al. (2007), Muñoz-Mateos et al. (2009), or Holwerda et al. (2011). This is most probably related to the pixel size of the images and the aperture within which the index is measured (Holwerda et al. 2011; Rodriguez-Gomez et al. 2019). In our analysis we used the same pixel size and segmentation map for all wavelengths, such that the measurements at different wavelengths can be directly compared.
Finally, for our sample of galaxies, we see a very steady pattern for M20 as a function of wavelength. It starts at a high value in the UV, rapidly drops to a minimum at optical–NIR wavelengths, and subsequently increases again in the MIR. This behavior is in agreement with Muñoz-Mateos et al. (2009). Across the entire MIR–submm range, the M20 index is more or less constant, and this is also reflected in the M20 indices of the dust mass and SFR maps.
Comparing the different panels of Fig. 4, it is evident that several of the nonparametric morphology indicators have a similar wavelength dependence. This is not surprising, as it has been demonstrated that different indicators are correlated to different degrees (Conselice 2003; Lotz et al. 2004; Scarlata et al. 2007; Muñoz-Mateos et al. 2009). In Fig. 5 we show the correlation between the different indicators considered in this study, together with the Spearman rank coefficients. The strongest correlations are those between concentration index on the one hand, and either Gini or M20 on the other. The weakest correlations are those between the half-light radius and any of the other nonparametric indicators.
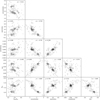 |
Fig. 5. Correlations between the different nonparametric morphology indicators considered in this study. The gray dots correspond to the indicator measurements for the individual galaxies in the different bands, the black crosses are the mean values. Spearman rank coefficients, based on the indicator values of the individual galxy images, are indicated in each panel. |
5. Discussion and conclusions
This study of a small sample of nearby DustPedia spiral galaxies serves as a proof-of-concept study for the application of nonparametric morphology over the entire UV–submm wavelength range. In particular, it is the first application of these indices to sufficiently resolved FIR and submm maps of galaxies and to the stellar mass, dust mass, and SFR maps of galaxies.
Nonparametric morphological studies of galaxies at optical wavelengths are usually performed to classify galaxies into different classes and/or to search for signatures of recent interactions (Lotz et al. 2006; Scarlata et al. 2007; Conselice et al. 2009; Huertas-Company et al. 2009; Fasano et al. 2012; Holwerda et al. 2014; Conselice 2014. While galaxy classification) could in principle be extended to include morphological information at FIR–submm wavelengths, this is not obvious at all, and this is not the main objective of this study. An in-depth analysis of the nonparametric morphology of the entire DustPedia galaxy sample and the link between morphology and physical properties will be considered in future work.
Our results can have some repercussions on our understanding of the structure of galaxies. Several previous studies have already indicated that star formation is distributed in a more clumpy and less concentrated way compared to stars in galaxies (e.g., Bendo et al. 2007; Muñoz-Mateos et al. 2009; Nelson et al. 2016; Belfiore et al. 2018; Morselli et al. 2019). In this paper we extend these studies to the cool interstellar dust traced by FIR–submm emission. One important lesson that can be learnt from Fig. 4 is that the interstellar dust in galaxies is distributed in a more extended, less concentrated, more asymmetric, and more clumpy way than the stars. This is clearly visible when comparing morphological indicators at, for example, 3.6 and 250 μm, or even more outspoken when comparing the indicators corresponding to the stellar and dust mass maps. This should serve as a warning sign against treating the dust in galaxies as a simple smooth component. Even more than stars, the dust distribution differs from a smooth axisymmetric, exponentially declining disk, although for the sake of simplicity this is often a convenient first-order approach (e.g., Xilouris et al. 1999; Bianchi et al. 2000; Möllenhoff et al. 2006; Baes et al. 2010; Gadotti et al. 2010; Popescu et al. 2011, 2017; De Geyter et al. 2014; Mosenkov et al. 2018). Detailed modeling of the interaction between dust and starlight on galactic scales should attempt to take into account the more complex morphology of the dust distribution (De Looze et al. 2014; Viaene et al. 2017, 2020; Williams et al. 2019; Verstocken et al. 2020; Nersesian et al. 2020).
This study also has implications for our understanding of the way galaxies evolve through cosmic times, in particular for numerical simulations of galaxy formation and evolution. Major cosmological hydrodynamics simulations are usually calibrated and tested using statistical distributions and scaling relations based on integrated luminosities or physical properties (e.g., Vogelsberger et al. 2014; Schaye et al. 2015; Davé et al. 2019; Pillepich et al. 2019). Galaxy morphology, which is the end product of external and internal physical processes alike, can serve as a new and critical test-bed for such studies. Nonparametric morphological indicators have been applied to synthetic images of simulated galaxies to test the fidelity of galaxy formation models (Snyder et al. 2015a,b; Bignone et al. 2017, 2020; Rodriguez-Gomez et al. 2019). These studies show the power of morphology as a test for galaxy evolution models. In particular, Rodriguez-Gomez et al. (2019) demonstrate the improvement of the TNG100 simulation (Nelson et al. 2018) compared to its predecessor Illustris (Vogelsberger et al. 2014) in terms of the position of galaxies in the Gini–M20 plane.
Our study now allows these morphology tests to be extended for simulated galaxies to wavelength bands beyond the traditional ones dominated by stellar emission. This is particularly timely because of recent developments in cosmological hydrodynamics simulations. The spatial resolution of cosmological hydrodynamics simulations has been steadily increasing over the past few years and, in particular, several suites of high-resolution zoom simulations have been presented (Hopkins et al. 2014; Wang et al. 2015; Grand et al. 2017; Font et al. 2020). A complementary development is the incorporation of dust physics into hydrodynamics simulations (McKinnon et al. 2017, 2018; Davé et al. 2019; Aoyama et al. 2020). In combination with the improved accuracy and power of radiative transfer post-processing algorithms (Jonsson et al. 2010; Camps et al. 2016, 2018; Trayford et al. 2017), this makes the morphology of galaxies from UV to submm wavelengths an interesting test for cosmological hydrodynamics simulations.
References
- Abraham, R. G., & Merrifield, M. R. 2000, AJ, 120, 2835 [NASA ADS] [CrossRef] [Google Scholar]
- Abraham, R. G., van den Bergh, S., & Nair, P. 2003, ApJ, 588, 218 [NASA ADS] [CrossRef] [Google Scholar]
- Aniano, G., Draine, B. T., Gordon, K. D., & Sandstrom, K. 2011, PASP, 123, 1218 [NASA ADS] [CrossRef] [Google Scholar]
- Aniano, G., Draine, B. T., Calzetti, D., et al. 2012, ApJ, 756, 138 [NASA ADS] [CrossRef] [Google Scholar]
- Aniano, G., Draine, B. T., Hunt, L. K., et al. 2020, ApJ, 889, 150 [NASA ADS] [CrossRef] [Google Scholar]
- Aoyama, S., Hirashita, H., & Nagamine, K. 2020, MNRAS, 491, 3844 [NASA ADS] [Google Scholar]
- Aswathy, S., & Ravikumar, C. D. 2018, MNRAS, 477, 2399 [NASA ADS] [CrossRef] [Google Scholar]
- Baes, M., Fritz, J., Gadotti, D. A., et al. 2010, A&A, 518, L39 [NASA ADS] [CrossRef] [EDP Sciences] [Google Scholar]
- Beck, M. R., Scarlata, C., Fortson, L. F., et al. 2018, MNRAS, 476, 5516 [CrossRef] [Google Scholar]
- Belfiore, F., Maiolino, R., Bundy, K., et al. 2018, MNRAS, 477, 3014 [NASA ADS] [CrossRef] [Google Scholar]
- Bendo, G. J., Calzetti, D., Engelbracht, C. W., et al. 2007, MNRAS, 380, 1313 [NASA ADS] [CrossRef] [Google Scholar]
- Bendo, G. J., Wilson, C. D., Pohlen, M., et al. 2010, A&A, 518, L65 [NASA ADS] [CrossRef] [EDP Sciences] [Google Scholar]
- Bendo, G. J., Boselli, A., Dariush, A., et al. 2012, MNRAS, 419, 1833 [NASA ADS] [CrossRef] [Google Scholar]
- Bershady, M. A., Jangren, A., & Conselice, C. J. 2000, AJ, 119, 2645 [NASA ADS] [CrossRef] [Google Scholar]
- Bianchi, S., Davies, J. I., & Alton, P. B. 2000, A&A, 359, 65 [NASA ADS] [Google Scholar]
- Bianchi, S., Casasola, V., Baes, M., et al. 2019, A&A, 631, A102 [NASA ADS] [CrossRef] [EDP Sciences] [Google Scholar]
- Bigiel, F., Leroy, A., Walter, F., et al. 2008, AJ, 136, 2846 [NASA ADS] [CrossRef] [Google Scholar]
- Bignone, L. A., Tissera, P. B., Sillero, E., et al. 2017, MNRAS, 465, 1106 [NASA ADS] [CrossRef] [Google Scholar]
- Bignone, L. A., Pedrosa, S. E., Trayford, J. W., Tissera, P. B., & Pellizza, L. J. 2020, MNRAS, 491, 3624 [Google Scholar]
- Bluck, A. F. L., Mendel, J. T., Ellison, S. L., et al. 2014, MNRAS, 441, 599 [NASA ADS] [CrossRef] [Google Scholar]
- Bottrell, C., Simard, L., Mendel, J. T., & Ellison, S. L. 2019, MNRAS, 486, 390 [CrossRef] [Google Scholar]
- Braine, J., Gratier, P., Kramer, C., et al. 2010, A&A, 518, L69 [NASA ADS] [CrossRef] [EDP Sciences] [Google Scholar]
- Bruce, V. A., Dunlop, J. S., Cirasuolo, M., et al. 2012, MNRAS, 427, 1666 [NASA ADS] [CrossRef] [Google Scholar]
- Bundy, K., Ellis, R. S., & Conselice, C. J. 2005, ApJ, 625, 621 [NASA ADS] [CrossRef] [Google Scholar]
- Calabrò, A., Daddi, E., Fensch, J., et al. 2019, A&A, 632, A98 [CrossRef] [EDP Sciences] [Google Scholar]
- Camps, P., Trayford, J. W., Baes, M., et al. 2016, MNRAS, 462, 1057 [CrossRef] [Google Scholar]
- Camps, P., Trčka, A., Trayford, J., et al. 2018, ApJS, 234, 20 [NASA ADS] [CrossRef] [EDP Sciences] [Google Scholar]
- Casasola, V., Cassarà, L. P., Bianchi, S., et al. 2017, A&A, 605, A18 [NASA ADS] [CrossRef] [EDP Sciences] [Google Scholar]
- Casasola, V., Bianchi, S., De Vis, P., et al. 2020, A&A, 633, A100 [NASA ADS] [CrossRef] [EDP Sciences] [Google Scholar]
- Cheng, T.-Y., Conselice, C. J., Aragón-Salamanca, A., et al. 2020, MNRAS, 493, 4209 [CrossRef] [Google Scholar]
- Clark, C. J. R., Verstocken, S., Bianchi, S., et al. 2018, A&A, 609, A37 [NASA ADS] [CrossRef] [EDP Sciences] [Google Scholar]
- Clark, C. J. R., De Vis, P., Baes, M., et al. 2019, MNRAS, 489, 5256 [NASA ADS] [CrossRef] [Google Scholar]
- Conselice, C. J. 2003, ApJS, 147, 1 [NASA ADS] [CrossRef] [Google Scholar]
- Conselice, C. J. 2014, ARA&A, 52, 291 [NASA ADS] [CrossRef] [Google Scholar]
- Conselice, C. J., Bershady, M. A., & Jangren, A. 2000, ApJ, 529, 886 [NASA ADS] [CrossRef] [Google Scholar]
- Conselice, C. J., Yang, C., & Bluck, A. F. L. 2009, MNRAS, 394, 1956 [NASA ADS] [CrossRef] [Google Scholar]
- Cutri, R. M., Skrutskie, M. F., van Dyk, S., et al. 2003, 2MASS All Sky Catalog of point sources (NASA/IPAC Infrared Science Archive) [Google Scholar]
- Davé, R., Anglés-Alcázar, D., Narayanan, D., et al. 2019, MNRAS, 486, 2827 [NASA ADS] [CrossRef] [Google Scholar]
- Davies, J. I., Baes, M., Bianchi, S., et al. 2017, PASP, 129, 044102 [NASA ADS] [CrossRef] [EDP Sciences] [Google Scholar]
- Davies, J. I., Nersesian, A., Baes, M., et al. 2019, A&A, 626, A63 [CrossRef] [EDP Sciences] [Google Scholar]
- De Geyter, G., Baes, M., Camps, P., et al. 2014, MNRAS, 441, 869 [NASA ADS] [CrossRef] [Google Scholar]
- de Jong, R. S. 1996, A&A, 313, 377 [NASA ADS] [Google Scholar]
- De Looze, I., Fritz, J., Baes, M., et al. 2014, A&A, 571, A69 [NASA ADS] [CrossRef] [EDP Sciences] [Google Scholar]
- Dieleman, S., Willett, K. W., & Dambre, J. 2015, MNRAS, 450, 1441 [NASA ADS] [CrossRef] [Google Scholar]
- Dressler, A. 1980, ApJ, 236, 351 [NASA ADS] [CrossRef] [Google Scholar]
- Fasano, G., Vanzella, E., Dressler, A., et al. 2012, MNRAS, 420, 926 [Google Scholar]
- Font, A. S., McCarthy, I. G., Poole-Mckenzie, R., et al. 2020, MNRAS, submitted [arXiv:2004.01914] [Google Scholar]
- Foyle, K., Wilson, C. D., Mentuch, E., et al. 2012, MNRAS, 421, 2917 [NASA ADS] [CrossRef] [Google Scholar]
- Freeman, P. E., Izbicki, R., Lee, A. B., et al. 2013, MNRAS, 434, 282 [NASA ADS] [CrossRef] [Google Scholar]
- Gadotti, D. A. 2009, MNRAS, 393, 1531 [NASA ADS] [CrossRef] [Google Scholar]
- Gadotti, D. A., Baes, M., & Falony, S. 2010, MNRAS, 403, 2053 [NASA ADS] [CrossRef] [Google Scholar]
- Gao, H., Ho, L. C., Barth, A. J., & Li, Z.-Y. 2018, ApJ, 862, 100 [NASA ADS] [CrossRef] [Google Scholar]
- Gini, C. 1912, Variabilità e mutabilità: contributo allo studio delle distribuzioni e delle relazioni statistiche (Tipogr. di P. Cuppini) [Google Scholar]
- Graham, A. W., Erwin, P., Caon, N., & Trujillo, I. 2001, ApJ, 563, L11 [NASA ADS] [CrossRef] [Google Scholar]
- Grand, R. J. J., Gómez, F. A., Marinacci, F., et al. 2017, MNRAS, 467, 179 [NASA ADS] [Google Scholar]
- Holwerda, B. W., Muñoz-Mateos, J. C., Comerón, S., et al. 2014, ApJ, 781, 12 [NASA ADS] [CrossRef] [Google Scholar]
- Holwerda, B. W., Pirzkal, N., de Blok, W. J. G., et al. 2011, MNRAS, 416, 2401 [NASA ADS] [CrossRef] [Google Scholar]
- Hopkins, P. F., Kereš, D., Oñorbe, J., et al. 2014, MNRAS, 445, 581 [NASA ADS] [CrossRef] [Google Scholar]
- Huertas-Company, M., Tasca, L., Rouan, D., et al. 2009, A&A, 497, 743 [NASA ADS] [CrossRef] [EDP Sciences] [Google Scholar]
- Huertas-Company, M., Gravet, R., Cabrera-Vives, G., et al. 2015, ApJS, 221, 8 [NASA ADS] [CrossRef] [Google Scholar]
- Hughes, T. M., Baes, M., Fritz, J., et al. 2014, A&A, 565, A4 [NASA ADS] [CrossRef] [EDP Sciences] [Google Scholar]
- Hunt, L. K., Draine, B. T., Bianchi, S., et al. 2015, A&A, 576, A33 [NASA ADS] [CrossRef] [EDP Sciences] [Google Scholar]
- Jones, A. P., Köhler, M., Ysard, N., Bocchio, M., & Verstraete, L. 2017, A&A, 602, A46 [NASA ADS] [CrossRef] [EDP Sciences] [Google Scholar]
- Jonsson, P., Groves, B. A., & Cox, T. J. 2010, MNRAS, 403, 17 [NASA ADS] [CrossRef] [Google Scholar]
- Kennedy, R., Bamford, S. P., Baldry, I., et al. 2015, MNRAS, 454, 806 [NASA ADS] [CrossRef] [Google Scholar]
- Kennicutt, R. C. Jr, Armus, L., Bendo, G., et al. 2003, PASP, 115, 928 [NASA ADS] [CrossRef] [Google Scholar]
- Kruk, S. J., Lintott, C. J., Bamford, S. P., et al. 2018, MNRAS, 473, 4731 [NASA ADS] [CrossRef] [Google Scholar]
- Lange, R., Moffett, A. J., Driver, S. P., et al. 2016, MNRAS, 462, 1470 [NASA ADS] [CrossRef] [Google Scholar]
- Law, D. R., Steidel, C. C., Erb, D. K., et al. 2007, ApJ, 656, 1 [NASA ADS] [CrossRef] [Google Scholar]
- Leroy, A. K., Walter, F., Brinks, E., et al. 2008, AJ, 136, 2782 [Google Scholar]
- Lotz, J. M., Primack, J., & Madau, P. 2004, AJ, 128, 163 [NASA ADS] [CrossRef] [Google Scholar]
- Lotz, J. M., Madau, P., Giavalisco, M., Primack, J., & Ferguson, H. C. 2006, ApJ, 636, 592 [NASA ADS] [CrossRef] [Google Scholar]
- Lotz, J. M., Davis, M., Faber, S. M., et al. 2008a, ApJ, 672, 177 [NASA ADS] [CrossRef] [Google Scholar]
- Lotz, J. M., Jonsson, P., Cox, T. J., & Primack, J. R. 2008b, MNRAS, 391, 1137 [Google Scholar]
- MacArthur, L. A., Courteau, S., & Holtzman, J. A. 2003, ApJ, 582, 689 [NASA ADS] [CrossRef] [Google Scholar]
- Martin, G., Kaviraj, S., Hocking, A., Read, S. C., & Geach, J. E. 2020, MNRAS, 491, 1408 [CrossRef] [Google Scholar]
- McKinnon, R., Torrey, P., Vogelsberger, M., Hayward, C. C., & Marinacci, F. 2017, MNRAS, 468, 1505 [NASA ADS] [CrossRef] [Google Scholar]
- McKinnon, R., Vogelsberger, M., Torrey, P., Marinacci, F., & Kannan, R. 2018, MNRAS, 478, 2851 [NASA ADS] [CrossRef] [Google Scholar]
- Meidt, S. E., Schinnerer, E., Knapen, J. H., et al. 2012, ApJ, 744, 17 [NASA ADS] [CrossRef] [Google Scholar]
- Méndez-Abreu, J., Ruiz-Lara, T., Sánchez-Menguiano, L., et al. 2017, A&A, 598, A32 [NASA ADS] [CrossRef] [EDP Sciences] [Google Scholar]
- Mentuch Cooper, E., Wilson, C. D., Foyle, K., et al. 2012, ApJ, 755, 165 [NASA ADS] [CrossRef] [Google Scholar]
- Möllenhoff, C., Popescu, C. C., & Tuffs, R. J. 2006, A&A, 456, 941 [NASA ADS] [CrossRef] [EDP Sciences] [Google Scholar]
- Morgan, W. W. 1958, PASP, 70, 364 [NASA ADS] [CrossRef] [Google Scholar]
- Morgan, W. W. 1959, PASP, 71, 394 [NASA ADS] [CrossRef] [Google Scholar]
- Morselli, L., Popesso, P., Cibinel, A., et al. 2019, A&A, 626, A61 [NASA ADS] [CrossRef] [EDP Sciences] [Google Scholar]
- Mosenkov, A. V., Allaert, F., Baes, M., et al. 2018, A&A, 616, A120 [NASA ADS] [CrossRef] [EDP Sciences] [Google Scholar]
- Mosenkov, A. V., Baes, M., Bianchi, S., et al. 2019, A&A, 622, A132 [NASA ADS] [CrossRef] [EDP Sciences] [Google Scholar]
- Muñoz-Mateos, J. C., Gil de Paz, A., Zamorano, J., et al. 2009, ApJ, 703, 1569 [NASA ADS] [CrossRef] [Google Scholar]
- Muñoz-Mateos, J. C., Boissier, S., Gil de Paz, A., et al. 2011, ApJ, 731, 10 [NASA ADS] [CrossRef] [Google Scholar]
- Nelson, E. J., van Dokkum, P. G., Förster Schreiber, N. M., et al. 2016, ApJ, 828, 27 [NASA ADS] [CrossRef] [Google Scholar]
- Nelson, D., Pillepich, A., Springel, V., et al. 2018, MNRAS, 475, 624 [NASA ADS] [CrossRef] [Google Scholar]
- Nersesian, A., Xilouris, E. M., Bianchi, S., et al. 2019, A&A, 624, A80 [NASA ADS] [CrossRef] [EDP Sciences] [Google Scholar]
- Nersesian, A., Verstocken, S., Viaene, S., et al. 2020, A&A, 637, A25 [CrossRef] [EDP Sciences] [Google Scholar]
- Okamura, S., Kodaira, K., & Watanabe, M. 1984, ApJ, 280, 7 [NASA ADS] [CrossRef] [Google Scholar]
- Pawlik, M. M., Wild, V., Walcher, C. J., et al. 2016, MNRAS, 456, 3032 [NASA ADS] [CrossRef] [Google Scholar]
- Pillepich, A., Nelson, D., Springel, V., et al. 2019, MNRAS, 490, 3196 [NASA ADS] [CrossRef] [Google Scholar]
- Popescu, C. C., Tuffs, R. J., Dopita, M. A., et al. 2011, A&A, 527, A109 [NASA ADS] [CrossRef] [EDP Sciences] [Google Scholar]
- Popescu, C. C., Yang, R., Tuffs, R. J., et al. 2017, MNRAS, 470, 2539 [NASA ADS] [CrossRef] [Google Scholar]
- Psychogyios, A., Charmandaris, V., Diaz-Santos, T., et al. 2016, A&A, 591, A1 [NASA ADS] [CrossRef] [EDP Sciences] [Google Scholar]
- Querejeta, M., Meidt, S. E., Schinnerer, E., et al. 2015, ApJS, 219, 5 [NASA ADS] [CrossRef] [Google Scholar]
- Rodriguez-Gomez, V., Snyder, G. F., Lotz, J. M., et al. 2019, MNRAS, 483, 4140 [NASA ADS] [CrossRef] [Google Scholar]
- Sandage, A. 2005, ARA&A, 43, 581 [NASA ADS] [CrossRef] [Google Scholar]
- Scarlata, C., Carollo, C. M., Lilly, S., et al. 2007, ApJS, 172, 406 [NASA ADS] [CrossRef] [Google Scholar]
- Schade, D., Lilly, S. J., Crampton, D., et al. 1995, ApJ, 451, L1 [NASA ADS] [CrossRef] [Google Scholar]
- Schaye, J., Crain, R. A., Bower, R. G., et al. 2015, MNRAS, 446, 521 [Google Scholar]
- Skibba, R. A., Bamford, S. P., Nichol, R. C., et al. 2009, MNRAS, 399, 966 [NASA ADS] [CrossRef] [Google Scholar]
- Smith, M. W. L., Eales, S. A., Gomez, H. L., et al. 2012, ApJ, 756, 40 [NASA ADS] [CrossRef] [Google Scholar]
- Smith, M. W. L., Eales, S. A., De Looze, I., et al. 2016, MNRAS, 462, 331 [NASA ADS] [CrossRef] [Google Scholar]
- Snyder, G. F., Lotz, J., Moody, C., et al. 2015a, MNRAS, 451, 4290 [CrossRef] [Google Scholar]
- Snyder, G. F., Torrey, P., Lotz, J. M., et al. 2015b, MNRAS, 454, 1886 [NASA ADS] [CrossRef] [Google Scholar]
- Trayford, J. W., Camps, P., Theuns, T., et al. 2017, MNRAS, 470, 771 [NASA ADS] [CrossRef] [Google Scholar]
- Tully, R. B. 1988, Nearby Galaxies Catalog (Cambridge University Press) [Google Scholar]
- Uzeirbegovic, E., Geach, J. E., & Kaviraj, S. 2020, MNRAS, in press [arXiv:2004.06734] [Google Scholar]
- van der Wel, A., Bell, E. F., Häussler, B., et al. 2012, ApJS, 203, 24 [NASA ADS] [CrossRef] [Google Scholar]
- Vazdekis, A., Trujillo, I., & Yamada, Y. 2004, ApJ, 601, L33 [NASA ADS] [CrossRef] [Google Scholar]
- Verstocken, S., Nersesian, A., Baes, M., et al. 2020, A&A, 637, A24 [NASA ADS] [CrossRef] [EDP Sciences] [Google Scholar]
- Viaene, S., Baes, M., Tamm, A., et al. 2017, A&A, 599, A64 [NASA ADS] [CrossRef] [EDP Sciences] [Google Scholar]
- Viaene, S., Nersesian, A., Fritz, J., et al. 2020, A&A, 638, A150 [CrossRef] [EDP Sciences] [Google Scholar]
- Vogelsberger, M., Genel, S., Springel, V., et al. 2014, MNRAS, 444, 1518 [NASA ADS] [CrossRef] [Google Scholar]
- Wang, L., Dutton, A. A., Stinson, G. S., et al. 2015, MNRAS, 454, 83 [NASA ADS] [CrossRef] [Google Scholar]
- Williams, T. G., Baes, M., De Looze, I., et al. 2019, MNRAS, 487, 2753 [NASA ADS] [CrossRef] [Google Scholar]
- Wu, X., Davé, R., Tacchella, S., & Lotz, J. 2020, MNRAS, 494, 5636 [Google Scholar]
- Xilouris, E. M., Byun, Y. I., Kylafis, N. D., Paleologou, E. V., & Papamastorakis, J. 1999, A&A, 344, 868 [NASA ADS] [Google Scholar]
All Tables
All Figures
|
Fig. 1. GALEX FUV, IRAC 3.6 μm, WISE 22 μm, and SPIRE 350 μm images for NGC 0628 (M 74), NGC 2403, NGC 3031 (M 81), NGC 3521, and NGC 3621. All images are convolved to the same FWHM and are shown on a square root scale. |
| In the text | |
|
Fig. 2. GALEX FUV, IRAC 3.6 μm, WISE 22 μm, and SPIRE 350 μm images for NGC 4725, NGC 4736 (M 94), NGC 5055 (M 63), and NGC 5457 (M 101). All images are convolved to the same FWHM and are shown on a square root scale. |
| In the text | |
|
Fig. 3. Nonparametric morphological indicators for each of the galaxies in our sample as a function of wavelength, and for the stellar mass, dust mass, and SFR maps. The different panels correspond to the half-light radius Rhalf normalized by the optical R25 diameter (top left), the concentration index (top right), the asymmetry index (middle left), the smoothness index (middle right), the Gini coefficient (bottom left), and the M20 indicator (bottom right). |
| In the text | |
|
Fig. 4. Nonparametric morphological indicators for the galaxy sample as a whole as a function of wavelength, and for the stellar mass, dust mass, and SFR maps. The different panels are the same as in Fig. 3. The gray lines are the measurements for the individual galaxies in the sample, and the black symbols and their error bars correspond to the mean and the standard deviation of the different indicators over our galaxy sample. |
| In the text | |
|
Fig. 5. Correlations between the different nonparametric morphology indicators considered in this study. The gray dots correspond to the indicator measurements for the individual galaxies in the different bands, the black crosses are the mean values. Spearman rank coefficients, based on the indicator values of the individual galxy images, are indicated in each panel. |
| In the text | |
Current usage metrics show cumulative count of Article Views (full-text article views including HTML views, PDF and ePub downloads, according to the available data) and Abstracts Views on Vision4Press platform.
Data correspond to usage on the plateform after 2015. The current usage metrics is available 48-96 hours after online publication and is updated daily on week days.
Initial download of the metrics may take a while.